Citibank 2009 Annual Report Download - page 133
Download and view the complete annual report
Please find page 133 of the 2009 Citibank annual report below. You can navigate through the pages in the report by either clicking on the pages listed below, or by using the keyword search tool below to find specific information within the annual report.-
 1
1 -
2
-
3
-
4
-
5
-
6
-
7
-
8
-
9
-
10
-
11
-
12
-
13
-
14
-
15
-
16
-
17
-
18
-
19
-
20
-
21
-
22
-
23
-
24
-
25
-
26
-
27
-
28
-
29
-
30
-
31
-
32
-
33
-
34
-
35
-
36
-
37
-
38
-
39
-
40
-
41
-
42
-
43
-
44
-
45
-
46
-
47
-
48
-
49
-
50
-
51
-
52
-
53
-
54
-
55
-
56
-
57
-
58
-
59
-
60
-
61
-
62
-
63
-
64
-
65
-
66
-
67
-
68
-
69
-
70
-
71
-
72
-
73
-
74
-
75
-
76
-
77
-
78
-
79
-
80
-
81
-
82
-
83
-
84
-
85
-
86
-
87
-
88
-
89
-
90
-
91
-
92
-
93
-
94
-
95
-
96
-
97
-
98
-
99
-
100
-
101
-
102
-
103
-
104
-
105
-
106
-
107
-
108
-
109
-
110
-
111
-
112
-
113
-
114
-
115
-
116
-
117
-
118
-
119
-
120
-
121
-
122
-
 123
123 -
 124
124 -
 125
125 -
 126
126 -
 127
127 -
 128
128 -
 129
129 -
 130
130 -
 131
131 -
 132
132 -
 133
133 -
 134
134 -
 135
135 -
 136
136 -
 137
137 -
 138
138 -
 139
139 -
 140
140 -
 141
141 -
 142
142 -
 143
143 -
144
-
145
-
146
-
147
-
148
-
149
-
150
-
151
-
152
-
153
-
154
-
155
-
156
-
157
-
158
-
159
-
160
-
161
-
162
-
163
-
164
-
165
-
166
-
167
-
168
-
169
-
170
-
171
-
172
-
173
-
174
-
175
-
176
-
177
-
178
-
179
-
180
-
181
-
182
-
183
-
184
-
185
-
186
-
187
-
188
-
189
-
190
-
191
-
192
-
193
-
194
-
195
-
196
-
197
-
198
-
199
-
200
-
201
-
202
-
203
-
204
-
205
-
206
-
207
-
208
-
209
-
210
-
211
-
212
-
213
-
214
-
215
-
216
-
217
-
218
-
219
-
220
-
221
-
222
-
223
-
224
-
225
-
226
-
227
-
228
-
229
-
230
-
231
-
232
-
233
-
234
-
235
-
236
-
237
-
238
-
239
-
240
-
241
-
242
-
243
-
244
-
245
-
246
-
247
-
248
-
249
-
250
-
251
-
252
-
253
-
254
-
255
-
256
-
257
-
258
-
259
-
260
-
261
-
262
-
263
-
264
-
265
-
266
-
267
-
268
-
269
-
270
-
271
-
272
-
273
-
274
-
275
-
276
-
277
-
278
-
279
-
280
-
281
-
282
-
283
-
284
 |
 |

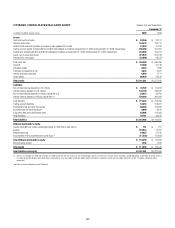
123
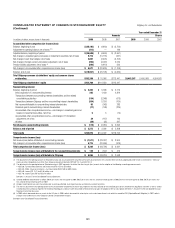
CONSOLIDATED STATEMENT OF CHANGES IN STOCKHOLDERS’ EQUITY Citigroup Inc. and Subsidiaries
(Continued)
Year ended December 31
Amounts Shares
In millions of dollars, except shares in thousands 2009 2008 2007 2009 2008 2007
Accumulated other comprehensive income (loss)
Balance, beginning of year $ (25,195) $ (4,660) $ (3,700)
Adjustment to opening balance, net of taxes (1)(5) (413) — 149
Adjusted balance, beginning of period $ (25,608) $ (4,660) $ (3,551)
Net change in unrealized gains and losses on investment securities, net of taxes 5,713 (10,118) (621)
Net change in cash flow hedges, net of taxes 2,007 (2,026) (3,102)
Net change in foreign currency translation adjustment, net of taxes (203) (6,972) 2,024
Pension liability adjustment, net of taxes (6) (846) (1,419) 590
Net change in Accumulated other comprehensive income (loss) $ 6,671 $ (20,535) $ (1,109)
Balance, end of year $ (18,937) $ (25,195) $ (4,660)
Total Citigroup common stockholders’ equity and common shares
outstanding $152,388 $ 70,966 $113,447 28,483,267 5,450,068 4,994,581
Total Citigroup stockholders’ equity $152,700 $141,630 $113,447
Noncontrolling interest
Balance, beginning of period $ 2,392 $ 5,308 $ 2,713
Initial origination of a noncontrolling interest 285 1,409 2,814
Transactions between noncontrolling interest shareholders and the related
consolidating subsidiary (134) (2,348) (573)
Transactions between Citigroup and the noncontrolling-interest shareholders (354) (1,207) (160)
Net income attributable to noncontrolling-interest shareholders 95 (343) 283
Dividends paid to noncontrolling–interest shareholders (17) (168) (226)
Accumulated other comprehensive income—net change in unrealized gains and
losses on investment securities, net of tax 53 (10)
Accumulated other comprehensive income—net change in FX translation
adjustment, net of tax 39 (167) 140
All other (38) (95) 327
Net change in noncontrolling interests $ (119) $ (2,916) $ 2,595
Balance, end of period $ 2,273 $ 2,392 $ 5,308
Total equity $154,973 $144,022 $118,755
Comprehensive income (loss)
Net income (loss) before attribution of noncontrolling interests $ (1,511) $ (28,027) $ 3,900
Net change in Accumulated other comprehensive income (loss) 6,715 (20,699) (979)
Total comprehensive income (loss) $ 5,204 $ (48,726) $ 2,921
Comprehensive income (loss) attributable to the noncontrolling interests $ 139 $ (507) $ 413
Comprehensive income (loss) attributable to Citigroup $ 5,065 $ (48,219) $ 2,508
(1) The adjustment to the opening balances for Retained earnings and Accumulated other comprehensive income (loss) represents the cumulative effect of initially adopting ASC 320-10-35-34, Investments—Debt and
Equity securities: Recognition of an Other-Than-Temporary Impairment (formerly FSP FAS 115-2 and FAS 124-2).
(2) The adjustment to the opening balance of Retained earnings in 2007 represents the total of the after-tax gain (loss) amounts for the adoption of the following accounting pronouncements:
• ASC 820, Fair Value Measurements and Disclosures (SFAS 157) for $75 million,
• ASC 825-10-05, Financial Instruments—Fair Value Option (SFAS 159) for $(99) million,
• ASC 840, Leases (FSP 13-2) for $(148) million, and
• ASC 740, Income Taxes (FIN 48) for $(14) million.
See Notes 1, 26 and 27 to the Consolidated Financial Statements.
(3) Common dividends declared were as follows: $0.01 per share in the first quarter of 2009, $0.32 per share in the first, second and third quarters of 2008, $0.16 in the fourth quarter of 2008; $0.54 per share in the
first, second, third and fourth quarters of 2007.
(4) All open market repurchases were transacted under an existing authorized share repurchase plan and relate to customer fails/errors.
(5) The after-tax adjustment to the opening balance of Accumulated other comprehensive income (loss) represents the reclassification of the unrealized gains (losses) related to the Legg Mason securities as well as several
miscellaneous items previously reported. The related unrealized gains and losses were reclassified to Retained earnings upon the adoption of the fair value option. See Notes 1, 26 and 27 to the Consolidated Financial
Statements for further discussion.
(6) In 2009, reflects decreased return on assets for the U.S. plan. In 2008, reflects decreased fair value of plan assets and a lower discount rate, which increased the PBO (Projected Benefit Obligation). In 2007, reflects
changes in the funded status of the Company’s pension and postretirement plans.
See Notes to the Consolidated Financial Statements.