Citibank 2009 Annual Report Download - page 168
Download and view the complete annual report
Please find page 168 of the 2009 Citibank annual report below. You can navigate through the pages in the report by either clicking on the pages listed below, or by using the keyword search tool below to find specific information within the annual report.-
 1
1 -
2
-
3
-
4
-
5
-
6
-
7
-
8
-
9
-
10
-
11
-
12
-
13
-
14
-
15
-
16
-
17
-
18
-
19
-
20
-
21
-
22
-
23
-
24
-
25
-
26
-
27
-
28
-
29
-
30
-
31
-
32
-
33
-
34
-
35
-
36
-
37
-
38
-
39
-
40
-
41
-
42
-
43
-
44
-
45
-
46
-
47
-
48
-
49
-
50
-
51
-
52
-
53
-
54
-
55
-
56
-
57
-
58
-
59
-
60
-
61
-
62
-
63
-
64
-
65
-
66
-
67
-
68
-
69
-
70
-
71
-
72
-
73
-
74
-
75
-
76
-
77
-
78
-
79
-
80
-
81
-
82
-
83
-
84
-
85
-
86
-
87
-
88
-
89
-
90
-
91
-
92
-
93
-
94
-
95
-
96
-
97
-
98
-
99
-
100
-
101
-
102
-
103
-
104
-
105
-
106
-
107
-
108
-
109
-
110
-
111
-
112
-
113
-
114
-
115
-
116
-
117
-
118
-
119
-
120
-
121
-
122
-
123
-
124
-
125
-
126
-
127
-
128
-
129
-
130
-
131
-
132
-
133
-
134
-
135
-
136
-
137
-
138
-
139
-
140
-
141
-
142
-
143
-
144
-
145
-
146
-
147
-
148
-
149
-
150
-
151
-
152
-
153
-
154
-
155
-
156
-
157
-
 158
158 -
 159
159 -
 160
160 -
 161
161 -
 162
162 -
 163
163 -
 164
164 -
 165
165 -
 166
166 -
 167
167 -
 168
168 -
 169
169 -
 170
170 -
 171
171 -
 172
172 -
 173
173 -
 174
174 -
 175
175 -
 176
176 -
 177
177 -
 178
178 -
179
-
180
-
181
-
182
-
183
-
184
-
185
-
186
-
187
-
188
-
189
-
190
-
191
-
192
-
193
-
194
-
195
-
196
-
197
-
198
-
199
-
200
-
201
-
202
-
203
-
204
-
205
-
206
-
207
-
208
-
209
-
210
-
211
-
212
-
213
-
214
-
215
-
216
-
217
-
218
-
219
-
220
-
221
-
222
-
223
-
224
-
225
-
226
-
227
-
228
-
229
-
230
-
231
-
232
-
233
-
234
-
235
-
236
-
237
-
238
-
239
-
240
-
241
-
242
-
243
-
244
-
245
-
246
-
247
-
248
-
249
-
250
-
251
-
252
-
253
-
254
-
255
-
256
-
257
-
258
-
259
-
260
-
261
-
262
-
263
-
264
-
265
-
266
-
267
-
268
-
269
-
270
-
271
-
272
-
273
-
274
-
275
-
276
-
277
-
278
-
279
-
280
-
281
-
282
-
283
-
284
 |
 |

158
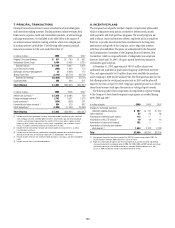
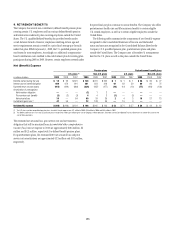
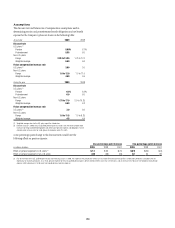
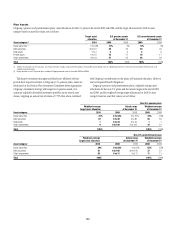
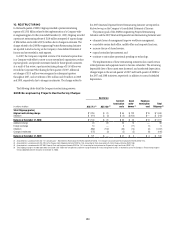
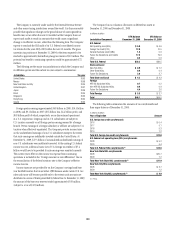
Assumptions
The discount rate and future rate of compensation assumptions used in
determining pension and postretirement benefit obligations and net benefit
expense for the Company’s plans are shown in the following table:
At year end 2009 2008
Discount rate
U.S. plans (1)
Pension 5.90% 6.1%
Postretirement 5.55 6.0
Non-U.S. plans
Range 2.00 to 13.25 1.75 to 17.0
Weighted average 6.50 6.6
Future compensation increase rate
U.S. plans (2) 3.00 3.0
Non-U.S. plans
Range 1.0 to 12.0 1.0 to 11.5
Weighted average 4.60 4.5
During the year 2009 2008
Discount rate
U.S. plans (1)
Pension 6.1% 6.2%
Postretirement 6.0 6.0
Non-U.S. plans
Range 1.75 to 17.0 2.0 to 10.25
Weighted average 6.60 6.2
Future compensation increase rate
U.S. plans (2) 3.0 3.0
Non-U.S. plans
Range 1.0 to 11.5 1.0 to 8.25
Weighted average 4.5 4.4
(1) Weighted-average rates for the U.S. plans equal the stated rates.
(2) Effective January 1, 2008, the U.S. qualified pension plan was frozen. Only the future compensation
increases for the grandfathered employees will affect future pension expense and obligations. Future
compensation increase rates for small groups of employees were 4% or 6%.
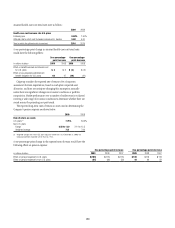
A one-percentage-point change in the discount rates would have the
following effects on pension expense:
One-percentage-point increase One-percentage-point decrease
In millions of dollars 2009 2008 2007 2009 2008 2007
Effect on pension expense for U.S. plans (1) $ 14 $ 36 $ 25 $(27) $(24) $ (5)
Effect on pension expense for non-U.S. plans (40) (58) (59) 62 94 80
(1) Due to the freeze of the U.S. qualified pension plan commencing January 1, 2008, the majority of the prospective service cost has been eliminated and the gain/loss amortization period was changed to the life
expectancy for inactive participants. As a result, pension expense for the U.S. qualified pension plan is driven more by interest costs than service costs, and an increase in the discount rate would increase pension
expense, while a decrease in the discount rate would decrease pension expense.