Citibank 2009 Annual Report Download - page 193
Download and view the complete annual report
Please find page 193 of the 2009 Citibank annual report below. You can navigate through the pages in the report by either clicking on the pages listed below, or by using the keyword search tool below to find specific information within the annual report.-
 1
1 -
2
-
3
-
4
-
5
-
6
-
7
-
8
-
9
-
10
-
11
-
12
-
13
-
14
-
15
-
16
-
17
-
18
-
19
-
20
-
21
-
22
-
23
-
24
-
25
-
26
-
27
-
28
-
29
-
30
-
31
-
32
-
33
-
34
-
35
-
36
-
37
-
38
-
39
-
40
-
41
-
42
-
43
-
44
-
45
-
46
-
47
-
48
-
49
-
50
-
51
-
52
-
53
-
54
-
55
-
56
-
57
-
58
-
59
-
60
-
61
-
62
-
63
-
64
-
65
-
66
-
67
-
68
-
69
-
70
-
71
-
72
-
73
-
74
-
75
-
76
-
77
-
78
-
79
-
80
-
81
-
82
-
83
-
84
-
85
-
86
-
87
-
88
-
89
-
90
-
91
-
92
-
93
-
94
-
95
-
96
-
97
-
98
-
99
-
100
-
101
-
102
-
103
-
104
-
105
-
106
-
107
-
108
-
109
-
110
-
111
-
112
-
113
-
114
-
115
-
116
-
117
-
118
-
119
-
120
-
121
-
122
-
123
-
124
-
125
-
126
-
127
-
128
-
129
-
130
-
131
-
132
-
133
-
134
-
135
-
136
-
137
-
138
-
139
-
140
-
141
-
142
-
143
-
144
-
145
-
146
-
147
-
148
-
149
-
150
-
151
-
152
-
153
-
154
-
155
-
156
-
157
-
158
-
159
-
160
-
161
-
162
-
163
-
164
-
165
-
166
-
167
-
168
-
169
-
170
-
171
-
172
-
173
-
174
-
175
-
176
-
177
-
178
-
179
-
180
-
181
-
182
-
 183
183 -
 184
184 -
 185
185 -
 186
186 -
 187
187 -
 188
188 -
 189
189 -
 190
190 -
 191
191 -
 192
192 -
 193
193 -
 194
194 -
 195
195 -
 196
196 -
 197
197 -
 198
198 -
 199
199 -
 200
200 -
 201
201 -
 202
202 -
 203
203 -
204
-
205
-
206
-
207
-
208
-
209
-
210
-
211
-
212
-
213
-
214
-
215
-
216
-
217
-
218
-
219
-
220
-
221
-
222
-
223
-
224
-
225
-
226
-
227
-
228
-
229
-
230
-
231
-
232
-
233
-
234
-
235
-
236
-
237
-
238
-
239
-
240
-
241
-
242
-
243
-
244
-
245
-
246
-
247
-
248
-
249
-
250
-
251
-
252
-
253
-
254
-
255
-
256
-
257
-
258
-
259
-
260
-
261
-
262
-
263
-
264
-
265
-
266
-
267
-
268
-
269
-
270
-
271
-
272
-
273
-
274
-
275
-
276
-
277
-
278
-
279
-
280
-
281
-
282
-
283
-
284
 |
 |

183
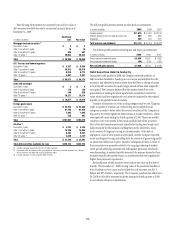
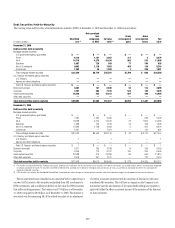
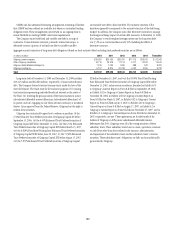
17. LOANS
In millions of dollars at year end 2009 (1) 2008 (1)
Consumer
In U.S. offices
Mortgage and real estate (2) $183,842 $219,482
Installment and other 58,099 64,319
Cards 28,951 44,418
Commercial and industrial 5,640 7,041
Lease financing 11 31
$276,543 $335,291
In offices outside the U.S.
Mortgage and real estate (2) $ 47,297 $ 44,382
Installment, revolving credit and other 42,805 41,272
Cards 41,493 42,586
Commercial and industrial 14,780 16,814
Lease financing 331 304
$146,706 $145,358
Total consumer loans $423,249 $480,649
Net unearned income 808 738
Consumer loans, net of unearned income $424,057 $481,387
Corporate
In U.S. offices
Commercial and industrial $ 15,614 $ 26,447
Loans to financial institutions 6,947 10,200
Mortgage and real estate (2) 22,560 28,043
Installment, revolving credit and other (3) 17,737 22,050
Lease financing 1,297 1,476
$ 64,155 $ 88,216
In offices outside the U.S.
Commercial and industrial $ 68,467 $ 79,809
Installment and other 9,683 17,441
Mortgage and real estate (2) 9,779 11,375
Loans to financial institutions 15,113 18,413
Lease financing 1,295 1,850
Governments and official institutions 1,229 385
$105,566 $129,273
Total corporate loans $169,721 $217,489
Net unearned income (4) (2,274) (4,660)
Corporate loans, net of unearned income $167,447 $212,829
(1) The Company classifies consumer and corporate loans based on the segment and sub-segment that
manages the loans. See Note 1 to the Consolidated Financial Statements.
(2) Loans secured primarily by real estate.
(3) Includes loans not otherwise separately categorized.
(4) The unearned income in 2008 includes loans that were transferred in that period from the held-for-sale
category to the held-for-investment category at a discount to par.
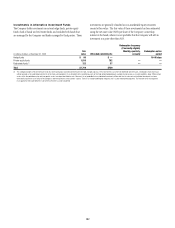
Included in the previous loan table are lending products whose terms
may give rise to additional credit issues. Credit cards with below-market
introductory interest rates, multiple loans supported by the same collateral
(e.g., home equity loans), and interest-only loans are examples of such
products. However, these products are not material to Citigroup’s financial
position and are closely managed via credit controls that mitigate their
additional inherent risk.
Impaired loans are those where Citigroup believes it is probable that it
will not collect all amounts due according to the original contractual terms
of the loan. Impaired loans include corporate non-accrual loans as well as
smaller-balance homogeneous loans whose terms have been modified due
to the borrower’s financial difficulties and Citigroup granted a concession to
the borrower. Such modifications may include interest rate reductions and/
or principal forgiveness. Valuation allowances for these loans are estimated
considering all available evidence including, as appropriate, the present
value of the expected future cash flows discounted at the loan’s original
contractual effective rate, the secondary market value of the loan and the fair
value of collateral less disposal costs. These totals exclude smaller-balance
homogeneous loans that have not been modified and are carried on a non-
accrual basis, as well as substantially all loans modified for periods of 12
months or less. At December 31, 2009, loans included in those short-term
programs amounted to $10.1 billion.
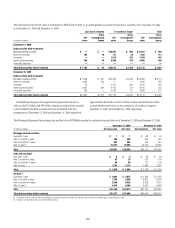
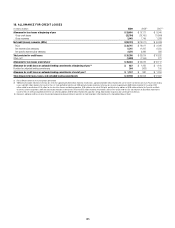
The following table presents information about impaired loans:
In millions of dollars at year end 2009 2008 2007
Impaired corporate loans
Commercial and industrial $ 6,413 $ 6,327 $ 246
Loans to financial institutions 1,794 2,635 1,122
Mortgage and real estate 4,051 407 59
Lease financing —35 —
Other 1,287 328 238
Total impaired corporate loans $13,545 $ 9,732 $ 1,665
Impaired consumer loans (1)
Mortgage and real estate $10,629 $ 5,023 $ 201
Installment and other 3,853 2,903 40
Cards 2,453 1,085 —
Total impaired consumer loans $16,935 $ 9,011 $ 241
Total (2) $30,480 $18,743 $ 1,906
Impaired corporate loans with valuation allowances $ 8,578 $ 7,300 $ 1,314
Impaired consumer loans with valuation allowances 16,453 8,573 —
Impaired corporate valuation allowance $ 2,480 $ 2,698 $ 388
Impaired consumer valuation allowance 4,977 2,373 —
Total valuation allowances (3) $ 7,457 $ 5,071 $ 388
During the year
Average balance of impaired corporate loans $12,990 $ 4,157 $ 967
Average balance of impaired consumer loans 14,049 5,266 —
Interest income recognized on
Impaired corporate loans $ 21 $ 49 $ 101
Impaired consumer loans 792 $ 276 —
(1) Prior to 2008, the Company’s financial accounting systems did not separately track impaired smaller-
balance, homogeneous consumer loans whose terms were modified due to the borrowers’ financial
difficulties and it was determined that a concession was granted to the borrower. At December 31,
2009 and 2008, such modified impaired consumer loans amounted to $15.899 and $8.151 billion,
respectively. However, information derived from the Company’s risk management systems indicates
that the amounts of such outstanding modified loans, including those modified prior to 2008,
approximated $18.1 billion, $12.3 billion and $7.0 billion at December 31, 2009, 2008 and 2007,
respectively.
(2) Excludes loans purchased for investment purposes.
(3) Included in the Allowance for loan losses.