Citibank 2009 Annual Report Download - page 75
Download and view the complete annual report
Please find page 75 of the 2009 Citibank annual report below. You can navigate through the pages in the report by either clicking on the pages listed below, or by using the keyword search tool below to find specific information within the annual report.-
 1
1 -
2
-
3
-
4
-
5
-
6
-
7
-
8
-
9
-
10
-
11
-
12
-
13
-
14
-
15
-
16
-
17
-
18
-
19
-
20
-
21
-
22
-
23
-
24
-
25
-
26
-
27
-
28
-
29
-
30
-
31
-
32
-
33
-
34
-
35
-
36
-
37
-
38
-
39
-
40
-
41
-
42
-
43
-
44
-
45
-
46
-
47
-
48
-
49
-
50
-
51
-
52
-
53
-
54
-
55
-
56
-
57
-
58
-
59
-
60
-
61
-
62
-
63
-
64
-
 65
65 -
 66
66 -
 67
67 -
 68
68 -
 69
69 -
 70
70 -
 71
71 -
 72
72 -
 73
73 -
 74
74 -
 75
75 -
 76
76 -
 77
77 -
 78
78 -
 79
79 -
 80
80 -
 81
81 -
 82
82 -
 83
83 -
 84
84 -
 85
85 -
86
-
87
-
88
-
89
-
90
-
91
-
92
-
93
-
94
-
95
-
96
-
97
-
98
-
99
-
100
-
101
-
102
-
103
-
104
-
105
-
106
-
107
-
108
-
109
-
110
-
111
-
112
-
113
-
114
-
115
-
116
-
117
-
118
-
119
-
120
-
121
-
122
-
123
-
124
-
125
-
126
-
127
-
128
-
129
-
130
-
131
-
132
-
133
-
134
-
135
-
136
-
137
-
138
-
139
-
140
-
141
-
142
-
143
-
144
-
145
-
146
-
147
-
148
-
149
-
150
-
151
-
152
-
153
-
154
-
155
-
156
-
157
-
158
-
159
-
160
-
161
-
162
-
163
-
164
-
165
-
166
-
167
-
168
-
169
-
170
-
171
-
172
-
173
-
174
-
175
-
176
-
177
-
178
-
179
-
180
-
181
-
182
-
183
-
184
-
185
-
186
-
187
-
188
-
189
-
190
-
191
-
192
-
193
-
194
-
195
-
196
-
197
-
198
-
199
-
200
-
201
-
202
-
203
-
204
-
205
-
206
-
207
-
208
-
209
-
210
-
211
-
212
-
213
-
214
-
215
-
216
-
217
-
218
-
219
-
220
-
221
-
222
-
223
-
224
-
225
-
226
-
227
-
228
-
229
-
230
-
231
-
232
-
233
-
234
-
235
-
236
-
237
-
238
-
239
-
240
-
241
-
242
-
243
-
244
-
245
-
246
-
247
-
248
-
249
-
250
-
251
-
252
-
253
-
254
-
255
-
256
-
257
-
258
-
259
-
260
-
261
-
262
-
263
-
264
-
265
-
266
-
267
-
268
-
269
-
270
-
271
-
272
-
273
-
274
-
275
-
276
-
277
-
278
-
279
-
280
-
281
-
282
-
283
-
284
 |
 |

65
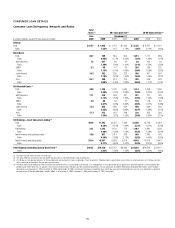
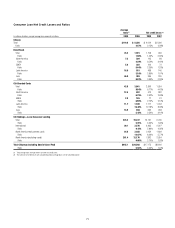
Details of Credit Loss Experience
In millions of dollars at year end 2009 2008 2007 2006 2005
Allowance for loan losses at beginning of year $29,616 $16,117 $ 8,940 $ 9,782 $11,269
Provision for loan losses
Consumer $32,418 $27,942 $15,660 $ 6,129 $ 7,149
Corporate 6,342 5,732 1,172 191 (295)
$38,760 $33,674 $16,832 $ 6,320 $ 6,854
Gross credit losses
Consumer
In U.S. offices $17,637 $11,624 $ 5,765 $ 4,413 $ 5,829
In offices outside the U.S. 8,834 7,172 5,165 3,932 2,964
Corporate
Mortgage and real estate
In U.S. offices 592 56 1 — —
In offices outside the U.S. 151 37 3 1 —
Governments and official institutions outside the U.S. —3 — — —
Loans to financial institutions
In U.S. offices 274 ————
In offices outside the U.S. 246 463 69 6 10
Commercial and industrial
In U.S. offices 3,299 627 635 85 78
In offices outside the U.S. 1,751 778 226 203 287
$32,784 $20,760 $11,864 $ 8,640 $ 9,168
Credit recoveries
Consumer
In U.S. offices $ 576 $ 585 $ 695 $ 646 $ 1,007
In offices outside the U.S. 1,089 1,050 966 897 693
Corporate
Mortgage and real estate
In U.S. offices 3— 3 5 —
In offices outside the U.S. 11 — 18 5
Governments and official institutions outside the U.S. —— 4 7 55
Loans to financial institutions
In U.S. offices —————
In offices outside the U.S. 11 2 1 4 15
Commercial and industrial
In U.S. offices 276 6 49 20 104
In offices outside the U.S. 87 105 220 182 473
$ 2,043 $ 1,749 $ 1,938 $ 1,779 $ 2,352
Net credit losses
In U.S. offices $20,947 $11,716 $ 5,654 $ 3,827 $ 4,796
In offices outside the U.S. 9,794 7,295 4,272 3,034 2,020
Total $30,741 $19,011 $ 9,926 $ 6,861 $ 6,816
Other—net (1) $ (1,602) $ (1,164) $ 271 $ (301) $ (1,525)
Allowance for loan losses at end of year $36,033 $29,616 $16,117 $ 8,940 $ 9,782
Allowance for unfunded lending commitments (2) $ 1,157 $ 887 $ 1,250 $ 1,100 $ 850
Total allowance for loans, leases and unfunded lending commitments $37,190 $30,503 $17,367 $10,040 $10,632
Net consumer credit losses $24,806 $17,161 $ 9,269 $ 6,802 $ 7,093
As a percentage of average consumer loans 5.44% 3.34% 1.87% 1.52% 1.76%
Net corporate credit losses (recoveries) $ 5,935 $ 1,850 $ 657 $ 59 $ (277)
As a percentage of average corporate loans 3.12% 0.84% 0.30% 0.05% NM
Allowance for loan losses at end of period (3)
Citicorp $10,066 $ 7,684 $ 4,910
Citi Holdings 25,967 21,932 11,207
Total Citigroup $36,033 $29,616 $16,117
(1) 2009 primarily includes reductions to the loan loss reserve of approximately $543 million related to securitizations, approximately $402 million related to the sale or transfers to held-for-sale of U.S. real estate lending
loans, and $562 million related to the transfer of the U.K. cards portfolio to held-for-sale. 2008 primarily includes reductions to the loan loss reserve of approximately $800 million related to FX translation, $102
million related to securitizations, $244 million for the sale of the German retail banking operation, $156 million for the sale of CitiCapital, partially offset by additions of $106 million related to the Cuscatlán and Bank
of Overseas Chinese acquisitions. 2007 primarily includes reductions to the loan loss reserve of $475 million related to securitizations and transfers to loans held-for-sale, and reductions of $83 million related to
the transfer of the U.K. CitiFinancial portfolio to held-for-sale, offset by additions of $610 million related to the acquisitions of Egg, Nikko Cordial, Grupo Cuscatlán and Grupo Financiero Uno. 2006 primarily includes
reductions to the loan-loss reserve of $429 million related to securitizations and portfolio sales and the addition of $84 million related to the acquisition of the CrediCard portfolio. 2005 primarily includes reductions
to the loan loss reserve of $584 million related to securitizations and portfolio sales, a reduction of $110 million related to purchase accounting adjustments from the KorAm acquisition, and a reduction of $90 million
from the sale of CitiCapital’s transportation portfolio.
(2) Represents additional credit loss reserves for unfunded lending commitments and letters of credit recorded in Other Liabilities on the Consolidated Balance Sheet.
(3) Allowance for loan losses represents management’s best estimate of probable losses inherent in the portfolio, as well as probable losses related to large individually evaluated impaired loans and troubled debt
restructurings. See “Significant Accounting Policies and Significant Estimates.” Attribution of the allowance is made for analytical purposes only, and the entire allowance is available to absorb probable credit losses
inherent in the overall portfolio.