Citibank 2009 Annual Report Download - page 111
Download and view the complete annual report
Please find page 111 of the 2009 Citibank annual report below. You can navigate through the pages in the report by either clicking on the pages listed below, or by using the keyword search tool below to find specific information within the annual report.-
 1
1 -
2
-
3
-
4
-
5
-
6
-
7
-
8
-
9
-
10
-
11
-
12
-
13
-
14
-
15
-
16
-
17
-
18
-
19
-
20
-
21
-
22
-
23
-
24
-
25
-
26
-
27
-
28
-
29
-
30
-
31
-
32
-
33
-
34
-
35
-
36
-
37
-
38
-
39
-
40
-
41
-
42
-
43
-
44
-
45
-
46
-
47
-
48
-
49
-
50
-
51
-
52
-
53
-
54
-
55
-
56
-
57
-
58
-
59
-
60
-
61
-
62
-
63
-
64
-
65
-
66
-
67
-
68
-
69
-
70
-
71
-
72
-
73
-
74
-
75
-
76
-
77
-
78
-
79
-
80
-
81
-
82
-
83
-
84
-
85
-
86
-
87
-
88
-
89
-
90
-
91
-
92
-
93
-
94
-
95
-
96
-
97
-
98
-
99
-
100
-
 101
101 -
 102
102 -
 103
103 -
 104
104 -
 105
105 -
 106
106 -
 107
107 -
 108
108 -
 109
109 -
 110
110 -
 111
111 -
 112
112 -
 113
113 -
 114
114 -
 115
115 -
 116
116 -
 117
117 -
 118
118 -
 119
119 -
 120
120 -
 121
121 -
122
-
123
-
124
-
125
-
126
-
127
-
128
-
129
-
130
-
131
-
132
-
133
-
134
-
135
-
136
-
137
-
138
-
139
-
140
-
141
-
142
-
143
-
144
-
145
-
146
-
147
-
148
-
149
-
150
-
151
-
152
-
153
-
154
-
155
-
156
-
157
-
158
-
159
-
160
-
161
-
162
-
163
-
164
-
165
-
166
-
167
-
168
-
169
-
170
-
171
-
172
-
173
-
174
-
175
-
176
-
177
-
178
-
179
-
180
-
181
-
182
-
183
-
184
-
185
-
186
-
187
-
188
-
189
-
190
-
191
-
192
-
193
-
194
-
195
-
196
-
197
-
198
-
199
-
200
-
201
-
202
-
203
-
204
-
205
-
206
-
207
-
208
-
209
-
210
-
211
-
212
-
213
-
214
-
215
-
216
-
217
-
218
-
219
-
220
-
221
-
222
-
223
-
224
-
225
-
226
-
227
-
228
-
229
-
230
-
231
-
232
-
233
-
234
-
235
-
236
-
237
-
238
-
239
-
240
-
241
-
242
-
243
-
244
-
245
-
246
-
247
-
248
-
249
-
250
-
251
-
252
-
253
-
254
-
255
-
256
-
257
-
258
-
259
-
260
-
261
-
262
-
263
-
264
-
265
-
266
-
267
-
268
-
269
-
270
-
271
-
272
-
273
-
274
-
275
-
276
-
277
-
278
-
279
-
280
-
281
-
282
-
283
-
284
 |
 |

101
the counterparties. Therefore, the CVA (both counterparty and own-credit)
may not be realized upon a settlement or termination in the normal course
of business. In addition, all or a portion of the credit valuation adjustments
may be reversed or otherwise adjusted in future periods in the event of
changes in the credit risk of Citi or its counterparties, or changes in the credit
mitigants (collateral and netting agreements) associated with the derivative
instruments. Historically, Citigroup’s credit spreads have moved in tandem
with general counterparty credit spreads, thus providing offsetting CVAs
affecting revenue. However, in the fourth quarter of 2008, Citigroup’s credit
spreads generally narrowed and counterparty credit spreads widened, each
of which negatively affected revenues in 2008. During 2009, both Citigroup’s
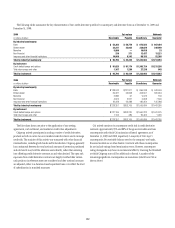
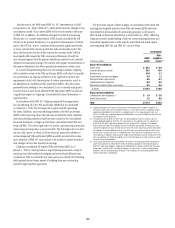
and counterparty credit spreads narrowed. The table below summarizes the
CVA applied to the fair value of derivative instruments as of December 31,
2009 and 2008.
Credit valuation adjustment
Contra-liability (contra-asset)
In millions of dollars
December 31,
2009
December 31,
2008
Non-monoline counterparties $(2,483) $(8,266)
Citigroup (own) 1,349 3,646
Net non-monoline CVA $(1,134) $(4,620)
Monoline counterparties (1) (5,580) (4,279)
Total CVA—derivative instruments $(6,714) $(8,899)
(1) Certain derivatives with monoline counterparties were terminated during 2008.
The table below summarizes pretax gains (losses) related to changes in
credit valuation adjustments on derivative instruments for the years ended
December 31, 2009 and 2008:
Credit valuation
adjustment gain
(loss)
In millions of dollars 2009 2008
Non-monoline counterparties $ 5,783 $ (6,653)
Citigroup (own) (2,297) 2,303
Net non-monoline CVA $ 3,486 $ (4,350)
Monoline counterparties (1,301) (5,736)
Total CVA—derivative instruments $ 2,185 $ (10,086)
The credit valuation adjustment amounts shown above relate solely to the
derivative portfolio, and do not include:
Own-credit adjustments for non-derivative liabilities measured at fair •
value under the fair value option. See Note 26 to the Consolidated
Financial Statements for further information.
The effect of counterparty credit risk embedded in non-derivative •
instruments. During 2008 and 2009 a range of financial instruments.
Losses on non-derivative instruments, such as bonds and loans, related to
counterparty credit risk are not included in the table above.
Credit Derivatives
Citigroup makes markets in and trades a range of credit derivatives, both
on behalf of clients as well as for its own account. Through these contracts
Citigroup either purchases or writes protection on either a single-name or
portfolio basis. Citi uses credit derivatives to help mitigate credit risk in its
corporate loan portfolio and other cash positions, to take proprietary trading
positions, and to facilitate client transactions.
Credit derivatives generally require that the seller of credit protection
make payments to the buyer upon the occurrence of predefined events
(settlement triggers). These settlement triggers, which are defined by the
form of the derivative and the referenced credit, are generally limited to
the market standard of failure to pay on indebtedness and bankruptcy (or
comparable events) of the reference credit and, in a more limited range of
transactions, debt restructuring.
Credit derivative transactions referring to emerging market reference
credits will also typically include additional settlement triggers to cover
the acceleration of indebtedness and the risk of repudiation or a payment
moratorium. In certain transactions on a portfolio of referenced credits
or asset-backed securities, the seller of protection may not be required
to make payment until a specified amount of losses has occurred with
respect to the portfolio and/or may only be required to pay for losses up to
a specified amount.