Citibank 2009 Annual Report Download - page 260
Download and view the complete annual report
Please find page 260 of the 2009 Citibank annual report below. You can navigate through the pages in the report by either clicking on the pages listed below, or by using the keyword search tool below to find specific information within the annual report.-
 1
1 -
2
-
3
-
4
-
5
-
6
-
7
-
8
-
9
-
10
-
11
-
12
-
13
-
14
-
15
-
16
-
17
-
18
-
19
-
20
-
21
-
22
-
23
-
24
-
25
-
26
-
27
-
28
-
29
-
30
-
31
-
32
-
33
-
34
-
35
-
36
-
37
-
38
-
39
-
40
-
41
-
42
-
43
-
44
-
45
-
46
-
47
-
48
-
49
-
50
-
51
-
52
-
53
-
54
-
55
-
56
-
57
-
58
-
59
-
60
-
61
-
62
-
63
-
64
-
65
-
66
-
67
-
68
-
69
-
70
-
71
-
72
-
73
-
74
-
75
-
76
-
77
-
78
-
79
-
80
-
81
-
82
-
83
-
84
-
85
-
86
-
87
-
88
-
89
-
90
-
91
-
92
-
93
-
94
-
95
-
96
-
97
-
98
-
99
-
100
-
101
-
102
-
103
-
104
-
105
-
106
-
107
-
108
-
109
-
110
-
111
-
112
-
113
-
114
-
115
-
116
-
117
-
118
-
119
-
120
-
121
-
122
-
123
-
124
-
125
-
126
-
127
-
128
-
129
-
130
-
131
-
132
-
133
-
134
-
135
-
136
-
137
-
138
-
139
-
140
-
141
-
142
-
143
-
144
-
145
-
146
-
147
-
148
-
149
-
150
-
151
-
152
-
153
-
154
-
155
-
156
-
157
-
158
-
159
-
160
-
161
-
162
-
163
-
164
-
165
-
166
-
167
-
168
-
169
-
170
-
171
-
172
-
173
-
174
-
175
-
176
-
177
-
178
-
179
-
180
-
181
-
182
-
183
-
184
-
185
-
186
-
187
-
188
-
189
-
190
-
191
-
192
-
193
-
194
-
195
-
196
-
197
-
198
-
199
-
200
-
201
-
202
-
203
-
204
-
205
-
206
-
207
-
208
-
209
-
210
-
211
-
212
-
213
-
214
-
215
-
216
-
217
-
218
-
219
-
220
-
221
-
222
-
223
-
224
-
225
-
226
-
227
-
228
-
229
-
230
-
231
-
232
-
233
-
234
-
235
-
236
-
237
-
238
-
239
-
240
-
241
-
242
-
243
-
244
-
245
-
246
-
247
-
248
-
249
-
 250
250 -
 251
251 -
 252
252 -
 253
253 -
 254
254 -
 255
255 -
 256
256 -
 257
257 -
 258
258 -
 259
259 -
 260
260 -
 261
261 -
 262
262 -
 263
263 -
 264
264 -
 265
265 -
 266
266 -
 267
267 -
 268
268 -
 269
269 -
 270
270 -
271
-
272
-
273
-
274
-
275
-
276
-
277
-
278
-
279
-
280
-
281
-
282
-
283
-
284
 |
 |

250
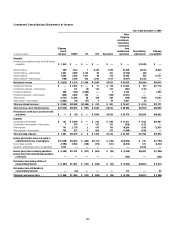
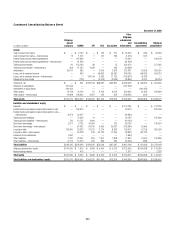
Condensed Consolidating Statements of Income
Year ended December 31, 2008
In millions of dollars
Citigroup
parent
company CGMHI CFI CCC Associates
Other
Citigroup
subsidiaries,
eliminations
and income
from
discontinued
operations
Consolidating
adjustments
Citigroup
consolidated
Revenues
Dividends from subsidiary banks and bank holding
companies $ 1,788 $ — $ — $ — $ — $ — $ (1,788) $ —
Interest revenue 758 18,569 3 7,218 8,261 78,908 (7,218) 106,499
Interest revenue—intercompany 4,822 2,109 5,156 67 575 (12,662) (67) —
Interest expense 9,455 11,607 3,294 141 608 27,786 (141) 52,750
Interest expense—intercompany (306) 5,014 290 2,435 2,202 (7,200) (2,435) —
Net interest revenue $ (3,569) $ 4,057 $ 1,575 $ 4,709 $ 6,026 $ 45,660 $ (4,709) $ 53,749
Commissions and fees $ (1) $ 7,361 $ — $ 87 $ 182 $ 2,824 $ (87) $ 10,366
Commissions and fees—intercompany — 521 — 37 52 (573) (37) —
Principal transactions (159) (22,175) 5,261 — (6) (5,522) — (22,601)
Principal transactions—intercompany 962 479 (4,070) — 180 2,449 — —
Other income (6,253) 2,896 (174) 389 344 13,272 (389) 10,085
Other income—intercompany 6,521 2,635 187 27 69 (9,412) (27) —
Total non-interest revenues $ 1,070 $ (8,283) $ 1,204 $ 540 $ 821 $ 3,038 $ (540) $ (2,150)
Total revenues, net of interest expense $ (711) $ (4,226) $ 2,779 $ 5,249 $ 6,847 $ 48,698 $ (7,037) $ 51,599
Provisions for credit losses and for benefits
and claims $ — $ 381 $ — $ 4,638 $ 5,020 $ 29,313 $ (4,638) $ 34,714
Expenses
Compensation and benefits $ (150) $ 9,651 $ — $ 667 $ 906 $ 20,689 $ (667) $ 31,096
Compensation and benefits—intercompany 9 912 — 188 189 (1,110) (188) —
Other expense 219 4,206 3 663 1,260 32,456 (663) 38,144
Other expense—intercompany 594 1,828 51 451 498 (2,971) (451) —
Total operating expenses $ 672 $ 16,597 $ 54 $ 1,969 $ 2,853 $ 49,064 $ (1,969) $ 69,240
Income (loss) before taxes and equity in
undistributed income of subsidiaries $ (1,383) $ (21,204) $ 2,725 $(1,358) $ (1,026) $(29,679) $ (430) $ (52,355)
Income taxes (benefits) (2,223) (8,463) 953 (526) (310) (10,283) 526 (20,326)
Equities in undistributed income of subsidiaries (29,122) — — — — — 29,122 —
Income (loss) from continuing operations $ (28,282) $ (12,741) $ 1,772 $ (832) $ (716) $(19,396) $28,166 $ (32,029)
Income from discontinued operations, net of
taxes 598 — — — — 3,404 — 4,002
Net income (loss) before attrition of
noncontrolling interest $ (27,684) $ (12,741) $ 1,772 $ (832) $ (716) $(15,992) $28,166 $ (28,027)
Net income (loss) attributable to
noncontrolling interests — (9) — — — $ (334) — $ (343)
Citigroup’s net income (loss) $ (27,684) $ (12,732) $ 1,772 $ (832) $ (716) $(15,658) $28,166 $ (27,684)