Citibank 2009 Annual Report Download - page 23
Download and view the complete annual report
Please find page 23 of the 2009 Citibank annual report below. You can navigate through the pages in the report by either clicking on the pages listed below, or by using the keyword search tool below to find specific information within the annual report.-
 1
1 -
2
-
3
-
4
-
5
-
6
-
7
-
8
-
9
-
10
-
11
-
12
-
 13
13 -
 14
14 -
 15
15 -
 16
16 -
 17
17 -
 18
18 -
 19
19 -
 20
20 -
 21
21 -
 22
22 -
 23
23 -
 24
24 -
 25
25 -
 26
26 -
 27
27 -
 28
28 -
 29
29 -
 30
30 -
 31
31 -
 32
32 -
 33
33 -
34
-
35
-
36
-
37
-
38
-
39
-
40
-
41
-
42
-
43
-
44
-
45
-
46
-
47
-
48
-
49
-
50
-
51
-
52
-
53
-
54
-
55
-
56
-
57
-
58
-
59
-
60
-
61
-
62
-
63
-
64
-
65
-
66
-
67
-
68
-
69
-
70
-
71
-
72
-
73
-
74
-
75
-
76
-
77
-
78
-
79
-
80
-
81
-
82
-
83
-
84
-
85
-
86
-
87
-
88
-
89
-
90
-
91
-
92
-
93
-
94
-
95
-
96
-
97
-
98
-
99
-
100
-
101
-
102
-
103
-
104
-
105
-
106
-
107
-
108
-
109
-
110
-
111
-
112
-
113
-
114
-
115
-
116
-
117
-
118
-
119
-
120
-
121
-
122
-
123
-
124
-
125
-
126
-
127
-
128
-
129
-
130
-
131
-
132
-
133
-
134
-
135
-
136
-
137
-
138
-
139
-
140
-
141
-
142
-
143
-
144
-
145
-
146
-
147
-
148
-
149
-
150
-
151
-
152
-
153
-
154
-
155
-
156
-
157
-
158
-
159
-
160
-
161
-
162
-
163
-
164
-
165
-
166
-
167
-
168
-
169
-
170
-
171
-
172
-
173
-
174
-
175
-
176
-
177
-
178
-
179
-
180
-
181
-
182
-
183
-
184
-
185
-
186
-
187
-
188
-
189
-
190
-
191
-
192
-
193
-
194
-
195
-
196
-
197
-
198
-
199
-
200
-
201
-
202
-
203
-
204
-
205
-
206
-
207
-
208
-
209
-
210
-
211
-
212
-
213
-
214
-
215
-
216
-
217
-
218
-
219
-
220
-
221
-
222
-
223
-
224
-
225
-
226
-
227
-
228
-
229
-
230
-
231
-
232
-
233
-
234
-
235
-
236
-
237
-
238
-
239
-
240
-
241
-
242
-
243
-
244
-
245
-
246
-
247
-
248
-
249
-
250
-
251
-
252
-
253
-
254
-
255
-
256
-
257
-
258
-
259
-
260
-
261
-
262
-
263
-
264
-
265
-
266
-
267
-
268
-
269
-
270
-
271
-
272
-
273
-
274
-
275
-
276
-
277
-
278
-
279
-
280
-
281
-
282
-
283
-
284
 |
 |

13
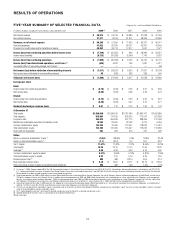
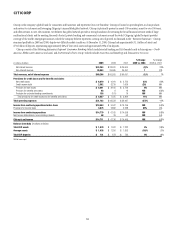
RESULTS OF OPERATIONS
FIVE-YEAR SUMMARY OF SELECTED FINANCIAL DATA Citigroup Inc. and Consolidated Subsidiaries
In millions of dollars, except per-share amounts, ratios and direct staff 2009 (1) 2008 2007 2006 2005
Net interest revenue $ 48,914 $ 53,749 $ 45,389 $ 37,928 $ 37,494
Non-interest revenue 31,371 (2,150) 31,911 48,399 42,583
Revenues, net of interest expense $ 80,285 $ 51,599 $ 77,300 $ 86,327 $ 80,077
Operating expenses 47,822 69,240 58,737 50,301 43,549
Provisions for credit losses and for benefits and claims 40,262 34,714 17,917 7,537 7,971
Income (loss) from continuing operations before income taxes $ (7,799) $ (52,355) $ 646 $ 28,489 $ 28,557
Income taxes (benefits) (6,733) (20,326) (2,546) 7,749 8,787
Income (loss) from continuing operations $ (1,066) $ (32,029) $ 3,192 $ 20,740 $ 19,770
Income (loss) from discontinued operations, net of taxes (2) (445) 4,002 708 1,087 5,417
Cumulative effect of accounting change, net of taxes (3) —— — — (49)
Net income (loss) before attribution of noncontrolling interests $ (1,511) $ (28,027) $ 3,900 $ 21,827 $ 25,138
Net income (loss) attributable to noncontrolling interests 95 (343) 283 289 549
Citigroup’s net income (loss) $ (1,606) $ (27,684) $ 3,617 $ 21,538 $ 24,589
Earnings per share
Basic:
Income (loss) from continuing operations $ (0.76) $ (6.39) $ 0.53 $ 4.07 $ 3.69
Net income (loss) (0.80) (5.63) 0.68 4.29 4.74
Diluted:
Income (loss) from continuing operations $ (0.76) $ (6.39) $ 0.53 $ 4.05 $ 3.67
Net income (loss) (0.80) (5.63) 0.67 4.27 4.71
Dividends declared per common share $ 0.01 $ 1.12 $ 2.16 $ 1.96 $ 1.76
At December 31
Total assets $1,856,646 $1,938,470 $2,187,480 $1,884,167 $1,493,886
Total deposits 835,903 774,185 826,230 712,041 591,828
Long-term debt 364,019 359,593 427,112 288,494 217,499
Mandatorily redeemable securities of subsidiary trusts 19,345 24,060 23,756 9,775 6,459
Common stockholders’ equity 152,388 70,966 113,447 118,632 111,261
Total stockholders’ equity 152,700 141,630 113,447 119,632 112,386
Direct staff (in thousands) 265 323 375 327 296
Ratios:
Return on common stockholders’ equity (4) (9.4)% (28.8)% 2.9% 18.8% 22.4%
Return on total stockholders’ equity (4) (1.1) (20.9) 3.0 18.7 22.2
Tier 1 Capital 11.67% 11.92% 7.12% 8.59% 8.79%
Total Capital 15.25 15.70 10.70 11.65 12.02
Leverage (5) 6.89 6.08 4.03 5.16 5.35
Common stockholders’ equity to assets 8.21% 3.66% 5.19% 6.30% 7.45%
Total stockholders’ equity to assets 8.22 7.31 5.19 6.35 7.52
Dividend payout ratio (6) NM NM 322.4 45.9 37.4
Book value per common share $ 5.35 $ 13.02 $ 22.71 $ 24.15 $ 22.34
Ratio of earnings to fixed charges and preferred stock dividends NM NM 1.01x 1.50x 1.79x
(1) On January 1, 2009, Citigroup adopted SFAS No. 160, Noncontrolling Interests in Consolidated Financial Statements (now ASC 810-10-45-15, Consolidation: Noncontrolling Interest in a Subsidiary), and FSP EITF 03-
6-1, “Determining Whether Instruments Granted in Share-Based Payment Transactions Are Participating Securities” (now ASC 260-10-45-59A, Earnings Per Share: Participating Securities and the Two-Class Method).
All prior periods have been restated to conform to the current period’s presentation.
(2) Discontinued operations for 2005 to 2009 reflect the sale of Nikko Cordial Securities to Sumitomo Mitsui Banking Corporation, the sale of Citigroup’s German retail banking operations to Crédit Mutuel, and the sale of
CitiCapital’s equipment finance unit to General Electric. In addition, discontinued operations for 2005 and 2006 include the operations and associated gain on sale of substantially all of Citigroup’s asset management
business, the majority of which closed on December 1, 2005. Discontinued operations from 2005 and 2006 also include the operations and associated gain on sale of Citigroup’s Travelers Life & Annuity, substantially
all of Citigroup’s international insurance business and Citigroup’s Argentine pension business to MetLife Inc., which closed on July 1, 2005. See Note 3 to the Consolidated Financial Statements.
(3) Accounting change of $(49) million in 2005 represents the adoption of Financial Accounting Standards Board (FASB) Interpretation No. 47, Accounting for Conditional Asset Retirement Obligations, an interpretation of
SFAS No. 143 (FIN 47) (now ASC 410-20, Asset Retirement and Environmental Obligations: Asset Retirement Obligations).
(4) The return on average common stockholders’ equity is calculated using net income less preferred stock dividends divided by average common stockholders’ equity. The return on total stockholders’ equity is calculated
using net income divided by average stockholders’ equity.
(5) Tier 1 Capital divided by each year’s fourth quarter adjusted average total assets (hereinafter as adjusted average total assets).
(6) Dividends declared per common share as a percentage of net income per diluted share.
NM Not meaningful