Citibank 2009 Annual Report Download - page 36
Download and view the complete annual report
Please find page 36 of the 2009 Citibank annual report below. You can navigate through the pages in the report by either clicking on the pages listed below, or by using the keyword search tool below to find specific information within the annual report.-
 1
1 -
2
-
3
-
4
-
5
-
6
-
7
-
8
-
9
-
10
-
11
-
12
-
13
-
14
-
15
-
16
-
17
-
18
-
19
-
20
-
21
-
22
-
23
-
24
-
25
-
 26
26 -
 27
27 -
 28
28 -
 29
29 -
 30
30 -
 31
31 -
 32
32 -
 33
33 -
 34
34 -
 35
35 -
 36
36 -
 37
37 -
 38
38 -
 39
39 -
 40
40 -
 41
41 -
 42
42 -
 43
43 -
 44
44 -
 45
45 -
 46
46 -
47
-
48
-
49
-
50
-
51
-
52
-
53
-
54
-
55
-
56
-
57
-
58
-
59
-
60
-
61
-
62
-
63
-
64
-
65
-
66
-
67
-
68
-
69
-
70
-
71
-
72
-
73
-
74
-
75
-
76
-
77
-
78
-
79
-
80
-
81
-
82
-
83
-
84
-
85
-
86
-
87
-
88
-
89
-
90
-
91
-
92
-
93
-
94
-
95
-
96
-
97
-
98
-
99
-
100
-
101
-
102
-
103
-
104
-
105
-
106
-
107
-
108
-
109
-
110
-
111
-
112
-
113
-
114
-
115
-
116
-
117
-
118
-
119
-
120
-
121
-
122
-
123
-
124
-
125
-
126
-
127
-
128
-
129
-
130
-
131
-
132
-
133
-
134
-
135
-
136
-
137
-
138
-
139
-
140
-
141
-
142
-
143
-
144
-
145
-
146
-
147
-
148
-
149
-
150
-
151
-
152
-
153
-
154
-
155
-
156
-
157
-
158
-
159
-
160
-
161
-
162
-
163
-
164
-
165
-
166
-
167
-
168
-
169
-
170
-
171
-
172
-
173
-
174
-
175
-
176
-
177
-
178
-
179
-
180
-
181
-
182
-
183
-
184
-
185
-
186
-
187
-
188
-
189
-
190
-
191
-
192
-
193
-
194
-
195
-
196
-
197
-
198
-
199
-
200
-
201
-
202
-
203
-
204
-
205
-
206
-
207
-
208
-
209
-
210
-
211
-
212
-
213
-
214
-
215
-
216
-
217
-
218
-
219
-
220
-
221
-
222
-
223
-
224
-
225
-
226
-
227
-
228
-
229
-
230
-
231
-
232
-
233
-
234
-
235
-
236
-
237
-
238
-
239
-
240
-
241
-
242
-
243
-
244
-
245
-
246
-
247
-
248
-
249
-
250
-
251
-
252
-
253
-
254
-
255
-
256
-
257
-
258
-
259
-
260
-
261
-
262
-
263
-
264
-
265
-
266
-
267
-
268
-
269
-
270
-
271
-
272
-
273
-
274
-
275
-
276
-
277
-
278
-
279
-
280
-
281
-
282
-
283
-
284
 |
 |

26
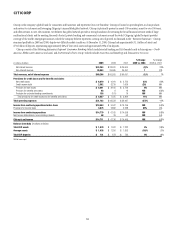
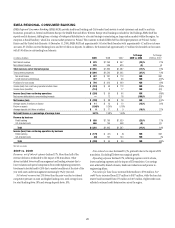
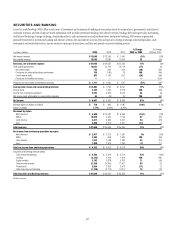
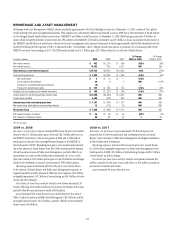
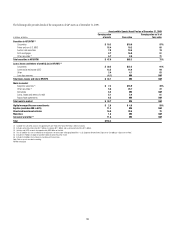
INSTITUTIONAL CLIENTS GROUP
Institutional Clients Group (ICG) includes Securities and Banking and Transaction Services. ICG provides corporate, institutional and high-net-worth
clients with a full range of products and services, including cash management, trading, underwriting, lending and advisory services, around the world.
ICG’s international presence is supported by trading floors in approximately 75 countries and a proprietary network within Transaction Services in over 90
countries. At December 31, 2009, ICG had approximately $866 billion of assets and $442 billion of deposits.
In millions of dollars 2009 2008 2007
% Change
2009 vs. 2008
% Change
2008 vs. 2007
Commissions and fees $ 2,075 $ 2,876 $ 3,156 (28)% (9)%
Administration and other fiduciary fees 4,964 5,413 5,014 (8) 8
Investment banking 4,685 3,329 5,399 41 (38)
Principal transactions 6,001 6,544 7,012 (8) (7)
Other 1,971 (1,021) 1,169 NM NM
Total non-interest revenue $ 19,696 $ 17,141 $ 21,750 15% (21)%
Net interest revenue (including dividends) 17,739 17,740 11,704 —52
Total revenues, net of interest expense $ 37,435 $ 34,881 $ 33,454 7% 4%
Total operating expenses 17,568 20,955 20,812 (16) 1
Net credit losses 723 917 310 (21) NM
Provision for unfunded lending commitments 138 (191) 79 NM NM
Credit reserve build 857 1,149 167 (25) NM
Provision for benefits and claims —— 1 —(100)
Provisions for loan losses and benefits and claims $ 1,718 $ 1,875 $ 557 (8)% NM
Income from continuing operations before taxes $ 18,149 $ 12,051 $ 12,085 51% —
Income taxes 5,261 2,746 3,116 92 (12)%
Income from continuing operations $ 12,888 $ 9,305 $ 8,969 39% 4%
Net income attributable to noncontrolling interests 68 18 45 NM (60)
Net income $ 12,820 $ 9,287 $ 8,924 38% 4%
Average assets (in billions of dollars) $ 839 $ 1,037 $ 1,154 (19)% (10)%
Return on assets 1.53% 0.90% 0.77%
Revenues by region
North America $ 11,926 $ 13,148 $ 10,644 (9)% 24%
EMEA 13,424 9,683 10,755 39 (10)
Latin America 4,784 3,808 4,360 26 (13)
Asia 7,301 8,242 7,695 (11) 7
Total $ 37,435 $ 34,881 $ 33,454 7% 4%
Income from continuing operations by region
North America $ 3,032 $ 2,598 $ 1,896 17% 37%
EMEA 4,680 1,902 2,411 NM (21)
Latin America 2,116 1,636 1,899 29 (14)
Asia 3,060 3,169 2,763 (3) 15
Total $ 12,888 $ 9,305 $ 8,969 39% 4%
Average loans by region (in billions of dollars)
North America $ 45 $ 50 $ 51 (10)% (2)%
EMEA 44 54 56 (19) (4)
Latin America 21 24 26 (13) (8)
Asia 28 37 38 (24) (3)
Total $ 138 $ 165 $ 171 (16)% (4)%
NM Not meaningful