Citibank 2009 Annual Report Download - page 52
Download and view the complete annual report
Please find page 52 of the 2009 Citibank annual report below. You can navigate through the pages in the report by either clicking on the pages listed below, or by using the keyword search tool below to find specific information within the annual report.-
 1
1 -
2
-
3
-
4
-
5
-
6
-
7
-
8
-
9
-
10
-
11
-
12
-
13
-
14
-
15
-
16
-
17
-
18
-
19
-
20
-
21
-
22
-
23
-
24
-
25
-
26
-
27
-
28
-
29
-
30
-
31
-
32
-
33
-
34
-
35
-
36
-
37
-
38
-
39
-
40
-
41
-
 42
42 -
 43
43 -
 44
44 -
 45
45 -
 46
46 -
 47
47 -
 48
48 -
 49
49 -
 50
50 -
 51
51 -
 52
52 -
 53
53 -
 54
54 -
 55
55 -
 56
56 -
 57
57 -
 58
58 -
 59
59 -
 60
60 -
 61
61 -
 62
62 -
63
-
64
-
65
-
66
-
67
-
68
-
69
-
70
-
71
-
72
-
73
-
74
-
75
-
76
-
77
-
78
-
79
-
80
-
81
-
82
-
83
-
84
-
85
-
86
-
87
-
88
-
89
-
90
-
91
-
92
-
93
-
94
-
95
-
96
-
97
-
98
-
99
-
100
-
101
-
102
-
103
-
104
-
105
-
106
-
107
-
108
-
109
-
110
-
111
-
112
-
113
-
114
-
115
-
116
-
117
-
118
-
119
-
120
-
121
-
122
-
123
-
124
-
125
-
126
-
127
-
128
-
129
-
130
-
131
-
132
-
133
-
134
-
135
-
136
-
137
-
138
-
139
-
140
-
141
-
142
-
143
-
144
-
145
-
146
-
147
-
148
-
149
-
150
-
151
-
152
-
153
-
154
-
155
-
156
-
157
-
158
-
159
-
160
-
161
-
162
-
163
-
164
-
165
-
166
-
167
-
168
-
169
-
170
-
171
-
172
-
173
-
174
-
175
-
176
-
177
-
178
-
179
-
180
-
181
-
182
-
183
-
184
-
185
-
186
-
187
-
188
-
189
-
190
-
191
-
192
-
193
-
194
-
195
-
196
-
197
-
198
-
199
-
200
-
201
-
202
-
203
-
204
-
205
-
206
-
207
-
208
-
209
-
210
-
211
-
212
-
213
-
214
-
215
-
216
-
217
-
218
-
219
-
220
-
221
-
222
-
223
-
224
-
225
-
226
-
227
-
228
-
229
-
230
-
231
-
232
-
233
-
234
-
235
-
236
-
237
-
238
-
239
-
240
-
241
-
242
-
243
-
244
-
245
-
246
-
247
-
248
-
249
-
250
-
251
-
252
-
253
-
254
-
255
-
256
-
257
-
258
-
259
-
260
-
261
-
262
-
263
-
264
-
265
-
266
-
267
-
268
-
269
-
270
-
271
-
272
-
273
-
274
-
275
-
276
-
277
-
278
-
279
-
280
-
281
-
282
-
283
-
284
 |
 |
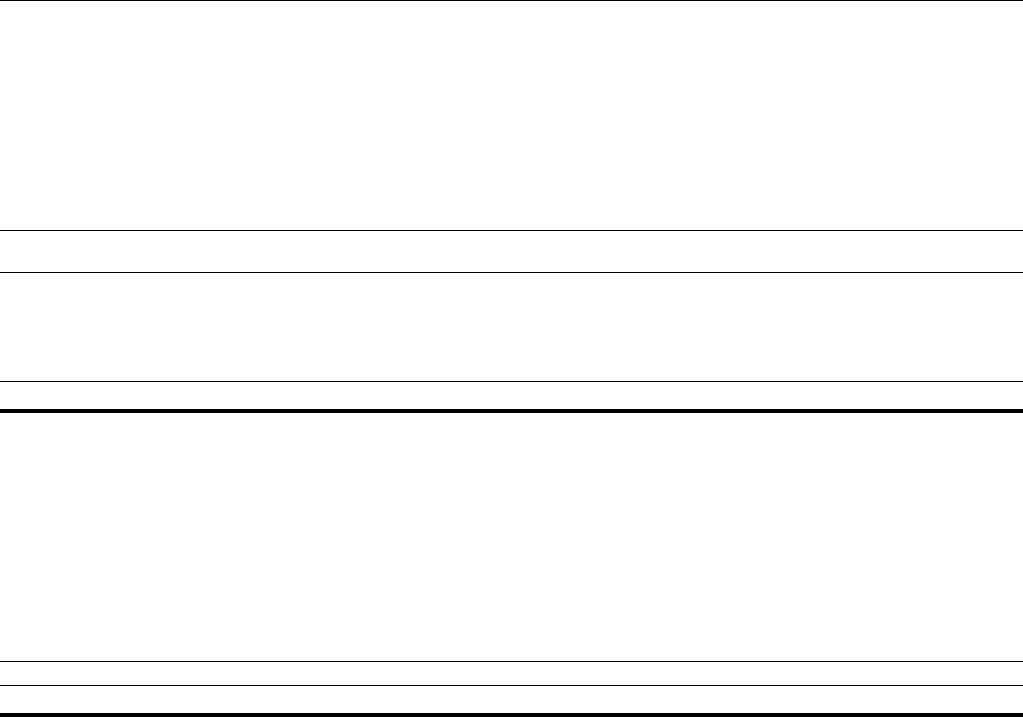
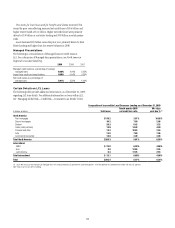
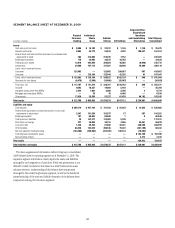
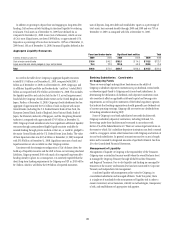
42
SEGMENT BALANCE SHEET AT DECEMBER 31, 2009
In millions of dollars
Regional
Consumer
Banking
Institutional
Clients
Group
Subtotal
Citicorp Citi Holdings
Corporate/Other,
Discontinued
Operations
and Consolidating
Eliminations
Total Citigroup
Consolidated
Assets
Cash and due from banks $ 8,005 $ 15,182 $ 23,187 $ 1,146 $ 1,139 $ 25,472
Deposits with banks 8,903 44,772 53,675 4,202 109,537 167,414
Federal funds sold and securities borrowed or purchased under
agreements to resell 264 214,606 214,870 7,152 — 222,022
Brokerage receivables 179 22,693 22,872 10,762 — 33,634
Trading account assets 13,818 293,046 306,864 42,855 (6,946) 342,773
Investments 34,466 107,115 141,581 86,049 78,489 306,119
Loans, net of unearned income
Consumer 123,663 — 123,663 299,887 507 424,057
Corporate — 125,164 125,164 42,242 41 167,447
Loans, net of unearned income $ 123,663 $ 125,164 $ 248,827 $342,129 $ 548 $ 591,504
Allowance for loan losses (6,476) (3,590) (10,066) (25,967) — (36,033)
Total loans, net $ 117,187 $ 121,574 $ 238,761 $316,162 $ 548 $ 555,471
Goodwill 9,593 10,357 19,950 5,442 — 25,392
Intangible assets (other than MSRs) 2,424 1,082 3,506 5,206 2 8,714
Mortgage servicing rights (MSRs) — 70 70 6,460 — 6,530
Other assets 17,929 35,308 53,237 61,676 48,192 163,105
Total assets $ 212,768 $ 865,805 $1,078,573 $547,112 $ 230,961 $1,856,646
Liabilities and equity
Total deposits $ 289,719 $ 441,720 $ 731,439 $ 91,542 $ 12,922 $ 835,903
Federal funds purchased and securities loaned or sold under
agreements to repurchase 2,347 151,530 153,877 37 367 154,281
Brokerage payables 187 60,653 60,840 1 5 60,846
Trading account liabilities 26 132,377 132,403 5,109 — 137,512
Short-term borrowings 227 30,085 30,312 4,526 34,041 68,879
Long-term debt 1,320 85,768 87,088 30,431 246,500 364,019
Other liabilities 62,428 143,678 206,106 75,322 (201,195) 80,233
Net inter-segment funding (lending) (143,486) (180,006) (323,492) 340,144 (16,652) —
Total Citigroup stockholders’ equity — — — — $ 152,700 $ 152,700
Noncontrolling interest — — — — 2,273 2,273
Total equity — — — — 154,973 154,973
Total liabilities and equity $ 212,768 $ 865,805 $1,078,573 $547,112 $ 230,961 $1,856,646
The above supplemental information reflects Citigroup’s consolidated
GAAP balance sheet by reporting segment as of December 31, 2009. The
respective segment information closely depicts the assets and liabilities
managed by each segment as of such date. While this presentation is not
defined by GAAP, Citi believes that these non-GAAP financial measures
enhance investors’ understanding of the balance sheet components
managed by the underlying business segments, as well as the beneficial
interrelationship of the asset and liability dynamics of the balance sheet
components among Citi’s business segments.