Citibank 2009 Annual Report Download - page 105
Download and view the complete annual report
Please find page 105 of the 2009 Citibank annual report below. You can navigate through the pages in the report by either clicking on the pages listed below, or by using the keyword search tool below to find specific information within the annual report.-
 1
1 -
2
-
3
-
4
-
5
-
6
-
7
-
8
-
9
-
10
-
11
-
12
-
13
-
14
-
15
-
16
-
17
-
18
-
19
-
20
-
21
-
22
-
23
-
24
-
25
-
26
-
27
-
28
-
29
-
30
-
31
-
32
-
33
-
34
-
35
-
36
-
37
-
38
-
39
-
40
-
41
-
42
-
43
-
44
-
45
-
46
-
47
-
48
-
49
-
50
-
51
-
52
-
53
-
54
-
55
-
56
-
57
-
58
-
59
-
60
-
61
-
62
-
63
-
64
-
65
-
66
-
67
-
68
-
69
-
70
-
71
-
72
-
73
-
74
-
75
-
76
-
77
-
78
-
79
-
80
-
81
-
82
-
83
-
84
-
85
-
86
-
87
-
88
-
89
-
90
-
91
-
92
-
93
-
94
-
 95
95 -
 96
96 -
 97
97 -
 98
98 -
 99
99 -
 100
100 -
 101
101 -
 102
102 -
 103
103 -
 104
104 -
 105
105 -
 106
106 -
 107
107 -
 108
108 -
 109
109 -
 110
110 -
 111
111 -
 112
112 -
 113
113 -
 114
114 -
 115
115 -
116
-
117
-
118
-
119
-
120
-
121
-
122
-
123
-
124
-
125
-
126
-
127
-
128
-
129
-
130
-
131
-
132
-
133
-
134
-
135
-
136
-
137
-
138
-
139
-
140
-
141
-
142
-
143
-
144
-
145
-
146
-
147
-
148
-
149
-
150
-
151
-
152
-
153
-
154
-
155
-
156
-
157
-
158
-
159
-
160
-
161
-
162
-
163
-
164
-
165
-
166
-
167
-
168
-
169
-
170
-
171
-
172
-
173
-
174
-
175
-
176
-
177
-
178
-
179
-
180
-
181
-
182
-
183
-
184
-
185
-
186
-
187
-
188
-
189
-
190
-
191
-
192
-
193
-
194
-
195
-
196
-
197
-
198
-
199
-
200
-
201
-
202
-
203
-
204
-
205
-
206
-
207
-
208
-
209
-
210
-
211
-
212
-
213
-
214
-
215
-
216
-
217
-
218
-
219
-
220
-
221
-
222
-
223
-
224
-
225
-
226
-
227
-
228
-
229
-
230
-
231
-
232
-
233
-
234
-
235
-
236
-
237
-
238
-
239
-
240
-
241
-
242
-
243
-
244
-
245
-
246
-
247
-
248
-
249
-
250
-
251
-
252
-
253
-
254
-
255
-
256
-
257
-
258
-
259
-
260
-
261
-
262
-
263
-
264
-
265
-
266
-
267
-
268
-
269
-
270
-
271
-
272
-
273
-
274
-
275
-
276
-
277
-
278
-
279
-
280
-
281
-
282
-
283
-
284
 |
 |

95
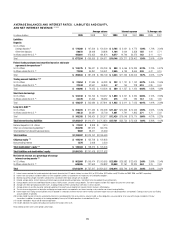
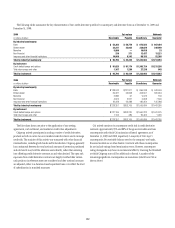
AVERAGE BALANCES AND INTEREST RATES—LIABILITIES AND EQUITY,
AND NET INTEREST REVENUE (1)(2)(3)(4)
Average volume Interest expense % Average rate
In millions of dollars 2009 2008 2007 2009 2008 2007 2009 2008 2007
Liabilities
Deposits
In U.S. offices
Savings deposits (5) $ 174,260 $ 167,509 $ 154,229 $ 2,765 $ 2,921 $ 4,772 1.59% 1.74% 3.09%
Other time deposits 59,673 58,998 58,808 1,104 2,604 3,358 1.85 4.41 5.71
In offices outside the U.S. (6) 443,601 473,452 481,874 6,277 14,746 20,272 1.42 3.11 4.21
Total $ 677,534 $ 699,959 $ 694,911 $ 10,146 $ 20,271 $ 28,402 1.50% 2.90% 4.09%
Federal funds purchased and securities loaned or sold under
agreements to repurchase (7)
In U.S. offices $ 133,375 $ 185,621 $ 244,258 $ 988 $ 5,066 $ 14,339 0.74% 2.73% 5.87 %
In offices outside the U.S. (6) 72,258 95,857 140,941 2,445 6,199 8,664 3.38 6.47 6.15
Total $ 205,633 $ 281,478 $ 385,199 $ 3,433 $ 11,265 $ 23,003 1.67% 4.00% 5.97%
Trading account liabilities (8) (9)
In U.S. offices $ 22,854 $ 31,984 $ 46,383 $ 222 $ 1,107 $ 1,142 0.97% 3.46% 2.46%
In offices outside the U.S. (6) 37,244 42,941 56,843 67 150 278 0.18 0.35 0.49
Total $ 60,098 $ 74,925 $ 103,226 $ 289 $ 1,257 $ 1,420 0.48% 1.68% 1.38%
Short-term borrowings
In U.S. offices $ 123,168 $ 154,190 $ 169,457 $ 1,050 $ 3,241 $ 6,234 0.85% 2.10% 3.68%
In offices outside the U.S. (6) 33,379 51,499 58,384 375 670 789 1.12 1.30 1.35
Total $ 156,547 $ 205,689 $ 227,841 $ 1,425 $ 3,911 $ 7,023 0.91% 1.90% 3.08%
Long-term debt (10)
In U.S. offices $ 316,223 $ 311,439 $ 266,968 $ 11,347 $ 14,305 $ 14,245 3.59% 4.59% 5.34%
In offices outside the U.S. (6) 29,132 36,981 35,709 1,081 1,741 1,865 3.71 4.71 5.22
Total $ 345,355 $ 348,420 $ 302,677 $ 12,428 $ 16,046 $ 16,110 3.60% 4.61% 5.32%
Total interest-bearing liabilities $1,445,167 $1,610,471 $1,713,854 $ 27,721 $ 52,750 $ 75,958 1.92% 3.28% 4.43%
Demand deposits in U.S. offices $ 27,032 $ 8,308 $ 7,510
Other non-interest-bearing liabilities (8) 263,296 381,912 300,156
Total liabilities from discontinued operations 9,502 28,471 23,969
Total liabilities $1,744,997 $2,029,162 $2,045,489
Citigroup equity (11) $ 144,510 $ 132,708 $ 122,823
Noncontrolling interest 1,874 5,608 3,220
Total stockholders’ equity (11) $ 146,384 $ 138,316 $ 126,043
Total liabilities and stockholders’ equity $1,891,381 $2,167,478 $2,171,532
Net interest revenue as a percentage of average
interest-earning assets (12)
In U.S. offices $ 962,084 $1,005,414 $1,079,565 $ 23,956 $ 25,982 $ 22,069 2.49% 2.58% 2.04%
In offices outside the U.S. (6) 649,995 731,903 794,832 24,958 27,767 23,320 3.84 3.79 2.93
Total $1,612,079 $1,737,317 $1,874,397 $ 48,914 $ 53,749 $ 45,389 3.03% 3.09% 2.42%
(1) Interest revenue excludes the taxable equivalent adjustments (based on the U.S. federal statutory tax rate of 35%) of $752 million, $323 million, and $125 million for 2009, 2008, and 2007, respectively.
(2) Interest rates and amounts include the effects of risk management activities associated with the respective asset and liability categories.
(3) Monthly or quarterly averages have been used by certain subsidiaries where daily averages are unavailable.
(4) Detailed average volume, interest revenue and interest expense exclude discontinued operations. See Note 3 to the Consolidated Financial Statements.
(5) Savings deposits consist of Insured Money Market accounts, NOW accounts, and other savings deposits. The interest expense includes FDIC deposit insurance fees and charges.
(6) Average rates reflect prevailing local interest rates, including inflationary effects and monetary corrections in certain countries.
(7) Average volumes of securities loaned or sold under agreements to repurchase are reported net. However, Interest revenue is reflected gross.
(8) The fair value carrying amounts of derivative and foreign exchange contracts are reported in non-interest-earning assets and other non-interest-bearing liabilities.
(9) Interest expense on Trading account liabilities of ICG is reported as a reduction of interest revenue. Interest revenue and interest expense on cash collateral positions are reported in Trading account assets and Trading
account liabilities, respectively.
(10) Excludes hybrid financial instruments and beneficial interests in consolidated VIEs that are classified as Long-term debt, as these obligations are accounted for at fair value with changes recorded in Principal
transactions. In addition, the majority of the funding provided by Treasury to CitiCapital operations is excluded from this line.
(11) Includes stockholders’ equity from discontinued operations.
(12) Includes allocations for capital and funding costs based on the location of the asset.
Reclassified to conform to the current period’s presentation.