Citibank 2009 Annual Report Download - page 190
Download and view the complete annual report
Please find page 190 of the 2009 Citibank annual report below. You can navigate through the pages in the report by either clicking on the pages listed below, or by using the keyword search tool below to find specific information within the annual report.-
 1
1 -
2
-
3
-
4
-
5
-
6
-
7
-
8
-
9
-
10
-
11
-
12
-
13
-
14
-
15
-
16
-
17
-
18
-
19
-
20
-
21
-
22
-
23
-
24
-
25
-
26
-
27
-
28
-
29
-
30
-
31
-
32
-
33
-
34
-
35
-
36
-
37
-
38
-
39
-
40
-
41
-
42
-
43
-
44
-
45
-
46
-
47
-
48
-
49
-
50
-
51
-
52
-
53
-
54
-
55
-
56
-
57
-
58
-
59
-
60
-
61
-
62
-
63
-
64
-
65
-
66
-
67
-
68
-
69
-
70
-
71
-
72
-
73
-
74
-
75
-
76
-
77
-
78
-
79
-
80
-
81
-
82
-
83
-
84
-
85
-
86
-
87
-
88
-
89
-
90
-
91
-
92
-
93
-
94
-
95
-
96
-
97
-
98
-
99
-
100
-
101
-
102
-
103
-
104
-
105
-
106
-
107
-
108
-
109
-
110
-
111
-
112
-
113
-
114
-
115
-
116
-
117
-
118
-
119
-
120
-
121
-
122
-
123
-
124
-
125
-
126
-
127
-
128
-
129
-
130
-
131
-
132
-
133
-
134
-
135
-
136
-
137
-
138
-
139
-
140
-
141
-
142
-
143
-
144
-
145
-
146
-
147
-
148
-
149
-
150
-
151
-
152
-
153
-
154
-
155
-
156
-
157
-
158
-
159
-
160
-
161
-
162
-
163
-
164
-
165
-
166
-
167
-
168
-
169
-
170
-
171
-
172
-
173
-
174
-
175
-
176
-
177
-
178
-
179
-
 180
180 -
 181
181 -
 182
182 -
 183
183 -
 184
184 -
 185
185 -
 186
186 -
 187
187 -
 188
188 -
 189
189 -
 190
190 -
 191
191 -
 192
192 -
 193
193 -
 194
194 -
 195
195 -
 196
196 -
 197
197 -
 198
198 -
 199
199 -
 200
200 -
201
-
202
-
203
-
204
-
205
-
206
-
207
-
208
-
209
-
210
-
211
-
212
-
213
-
214
-
215
-
216
-
217
-
218
-
219
-
220
-
221
-
222
-
223
-
224
-
225
-
226
-
227
-
228
-
229
-
230
-
231
-
232
-
233
-
234
-
235
-
236
-
237
-
238
-
239
-
240
-
241
-
242
-
243
-
244
-
245
-
246
-
247
-
248
-
249
-
250
-
251
-
252
-
253
-
254
-
255
-
256
-
257
-
258
-
259
-
260
-
261
-
262
-
263
-
264
-
265
-
266
-
267
-
268
-
269
-
270
-
271
-
272
-
273
-
274
-
275
-
276
-
277
-
278
-
279
-
280
-
281
-
282
-
283
-
284
 |
 |

180
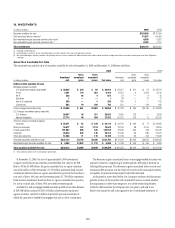
Mortgage-backed securities
For U.S. mortgage-backed securities (and in particular for Alt-A and other
mortgage-backed securities that have significant unrealized losses as a
percentage of amortized cost), credit impairment is assessed using a cash
flow model that estimates the cash flows on the underlying mortgages, using
the security-specific collateral and transaction structure. The model estimates
cash flows from the underlying mortgage loans and distributes those cash
flows to various tranches of securities, considering the transaction structure
and any subordination and credit enhancements that exist in that structure.
The cash flow model incorporates actual cash flows on the mortgage-backed
securities through the current period and then projects the remaining cash
flows using a number of assumptions, including default rates, prepayment
rates, and recovery rates (on foreclosed properties).
Management develops specific assumptions using as much market data
as possible and includes internal estimates as well as estimates published
by rating agencies and other third-party sources. Default rates are projected
by considering current underlying mortgage loan performance, generally
assuming the default of (1) 10% of current loans, (2) 25% of 30–59 day
delinquent loans, (3) 75% of 60–90 day delinquent loans and (4) 100%
of 91+ day delinquent loans. These estimates are extrapolated along a
default timing curve to estimate the total lifetime pool default rate. Other
assumptions used contemplate the actual collateral attributes, including
geographic concentrations, rating agency loss projections, rating actions and
current market prices.
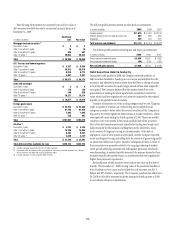
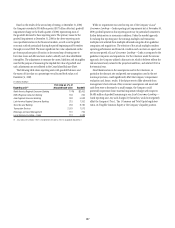
The key base assumptions for mortgage-backed securities as of
December 31, 2009 are in the table below:
December 31, 2009
Prepayment rate 3–8 CRR
Loss severity (1) 45%–75%
Unemployment rate 10%
Peak-to-trough housing price decline 32.3%
(1) Loss severity rates are estimated considering collateral characteristics and generally range from
45%–60% for prime bonds, 50%–70% for Alt-A bonds, and 65%–75% for subprime bonds.
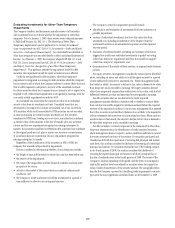
In addition, cash flow projections are developed using more stressful
parameters, and management assesses the results of those stress tests
(including the severity of any cash shortfall indicated and the likelihood
of the stress scenarios actually occurring based on the underlying pool’s
characteristics and performance) to assess whether management expects
to recover the amortized cost basis of the security. If cash flow projections
indicate that the Company does not expect to recover its amortized cost basis,
the Company recognizes the estimated credit loss in earnings.
State and municipal securities
Citigroup’s AFS state and municipal bonds consist mainly of bonds that are
financed through Tender Option Bond programs. The process for identifying
credit impairment for bonds in this program as well as for bonds that
were previously financed in this program is largely based on third-party
credit ratings. Individual bond positions must meet minimum ratings
requirements, which vary based on the sector of the bond issuer. The average
portfolio rating, ignoring any insurance, is Aa3/AA-.
Citigroup monitors the bond issuer and insurer ratings on a daily basis.
In the event of a downgrade of the bond below the Aa3/AA-, the subject bond
is specifically reviewed for potential shortfall in contractual principal and
interest. Citigroup has not recorded any credit impairments on bonds held
as part of the Tender Option Bond program or on bonds that were previously
held as part of the Tender Option Bond program.
The remainder of Citigroup’s AFS state and municipal bonds, outside
of the above, are specifically reviewed for credit impairment based on
instrument-specific estimates of cash flows, probability of default and loss
given default.
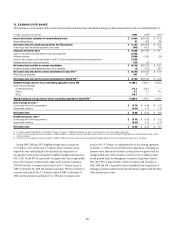
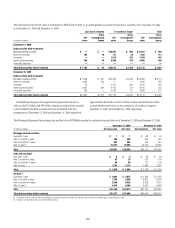
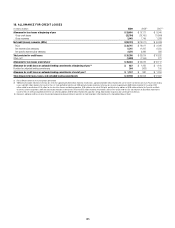
Recognition and Measurement of Other-Than-Temporary Impairment
The following table presents the total other-than-temporary impairments recognized during the 12 months ended December 31, 2009:
Other-Than-Temporary Impairments (OTTI) on Investments Year ended December 31, 2009
In millions of dollars AFS HTM Total
Impairment losses related to securities that the Company does not intend to sell nor will
likely be required to sell
Total OTTI losses recognized during the year ended December 31, 2009 $468 $6,600 $ 7,068
Less: portion of OTTI loss recognized in AOCI (before taxes) 60 4,296 4,356
Net impairment losses recognized in earnings for securities that the Company does not intend
to sell nor will likely be required to sell $408 $ 2,304 $2,712
OTTI losses recognized in earnings for securities that the Company intends to sell or more-
likely-than-not will be required to sell before recovery 194 — 194
Total impairment losses recognized in earnings $602 $ 2,304 $2,906