Citibank 2009 Annual Report Download - page 41
Download and view the complete annual report
Please find page 41 of the 2009 Citibank annual report below. You can navigate through the pages in the report by either clicking on the pages listed below, or by using the keyword search tool below to find specific information within the annual report.-
 1
1 -
2
-
3
-
4
-
5
-
6
-
7
-
8
-
9
-
10
-
11
-
12
-
13
-
14
-
15
-
16
-
17
-
18
-
19
-
20
-
21
-
22
-
23
-
24
-
25
-
26
-
27
-
28
-
29
-
30
-
 31
31 -
 32
32 -
 33
33 -
 34
34 -
 35
35 -
 36
36 -
 37
37 -
 38
38 -
 39
39 -
 40
40 -
 41
41 -
 42
42 -
 43
43 -
 44
44 -
 45
45 -
 46
46 -
 47
47 -
 48
48 -
 49
49 -
 50
50 -
 51
51 -
52
-
53
-
54
-
55
-
56
-
57
-
58
-
59
-
60
-
61
-
62
-
63
-
64
-
65
-
66
-
67
-
68
-
69
-
70
-
71
-
72
-
73
-
74
-
75
-
76
-
77
-
78
-
79
-
80
-
81
-
82
-
83
-
84
-
85
-
86
-
87
-
88
-
89
-
90
-
91
-
92
-
93
-
94
-
95
-
96
-
97
-
98
-
99
-
100
-
101
-
102
-
103
-
104
-
105
-
106
-
107
-
108
-
109
-
110
-
111
-
112
-
113
-
114
-
115
-
116
-
117
-
118
-
119
-
120
-
121
-
122
-
123
-
124
-
125
-
126
-
127
-
128
-
129
-
130
-
131
-
132
-
133
-
134
-
135
-
136
-
137
-
138
-
139
-
140
-
141
-
142
-
143
-
144
-
145
-
146
-
147
-
148
-
149
-
150
-
151
-
152
-
153
-
154
-
155
-
156
-
157
-
158
-
159
-
160
-
161
-
162
-
163
-
164
-
165
-
166
-
167
-
168
-
169
-
170
-
171
-
172
-
173
-
174
-
175
-
176
-
177
-
178
-
179
-
180
-
181
-
182
-
183
-
184
-
185
-
186
-
187
-
188
-
189
-
190
-
191
-
192
-
193
-
194
-
195
-
196
-
197
-
198
-
199
-
200
-
201
-
202
-
203
-
204
-
205
-
206
-
207
-
208
-
209
-
210
-
211
-
212
-
213
-
214
-
215
-
216
-
217
-
218
-
219
-
220
-
221
-
222
-
223
-
224
-
225
-
226
-
227
-
228
-
229
-
230
-
231
-
232
-
233
-
234
-
235
-
236
-
237
-
238
-
239
-
240
-
241
-
242
-
243
-
244
-
245
-
246
-
247
-
248
-
249
-
250
-
251
-
252
-
253
-
254
-
255
-
256
-
257
-
258
-
259
-
260
-
261
-
262
-
263
-
264
-
265
-
266
-
267
-
268
-
269
-
270
-
271
-
272
-
273
-
274
-
275
-
276
-
277
-
278
-
279
-
280
-
281
-
282
-
283
-
284
 |
 |

31
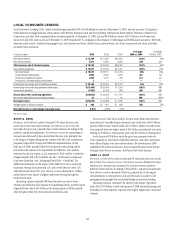
BROKERAGE AND ASSET MANAGEMENT
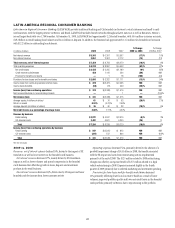
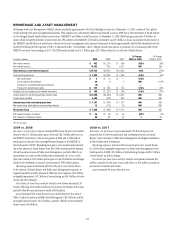
Brokerage and Asset Management (BAM), which constituted approximately 6% of Citi Holdings by assets as of December 31, 2009, consists of Citi’s global
retail brokerage and asset management businesses. This segment was substantially affected and reduced in size in 2009 due to the divestitures of Smith Barney
(to the Morgan Stanley Smith Barney joint venture (MSSB JV)) and Nikko Cordial Securities. At December 31, 2009, BAM had approximately $35 billion of
assets, which included $26 billion of assets from the 49% interest in the MSSB JV ($13 billion investment and $13 billion in loans associated with the clients of
the MSSB JV) and $9 billion of assets from a diverse set of asset management and insurance businesses of which approximately half will be transferred into the
LATAM RCB during the first quarter of 2010, as discussed under “Citi Holdings” above. Morgan Stanley has options to purchase Citi’s remaining stake in the
MSSB JV over three years starting in 2012. The 2009 results include an $11.1 billion gain ($6.7 billion after-tax) on the sale of Smith Barney.
In millions of dollars 2009 2008 2007
% Change
2009 vs. 2008
% Change
2008 vs. 2007
Net interest revenue $ 432 $ 1,224 $ 908 (65)% 35%
Non-interest revenue 14,703 7,199 9,751 NM (26)
Total revenues, net of interest expense $ 15,135 $ 8,423 $ 10,659 80% (21)%
Total operating expenses $ 3,350 $ 9,236 $ 7,960 (64)% 16%
Net credit losses $ 3 $ 10 $ — (70)% —
Credit reserve build/(release) 36 8 4 NM 100%
Provision for unfunded lending commitments (5) — — ——
Provision for benefits and claims $ 155 $ 205 $ 154 (24)% 33%
Provisions for loan losses and for benefits and claims $ 189 $ 223 $ 158 (15)% 41%
Income (loss) from continuing operations before taxes $ 11,596 $(1,036) $ 2,541 NM NM
Income taxes (benefits) 4,489 (272) 834 NM NM
Income (loss) from continuing operations $ 7,107 $ (764) $ 1,707 NM NM
Net income (loss) attributable to noncontrolling interests 12 (179) 35 NM NM
Net income (loss) $ 7,095 $ (585) $ 1,672 NM NM
EOP assets (in billions of dollars) $ 35 $ 58 $ 56 (40)% 4%
EOP deposits (in billions of dollars) 60 58 46 326
NM Not meaningful
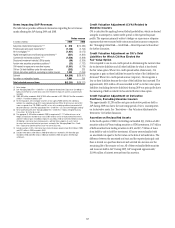
2009 vs. 2008
Revenues, net of interest expense increased 80% versus the prior year mainly
driven by the $11.1 billion pretax gain on the sale ($6.7 billion after-tax) on
the MSSB JV transaction in the second quarter of 2009 and a $320 million
pretax gain on the sale of the managed futures business to the MSSB JV in
the third quarter of 2009. Excluding these gains, revenue decreased primarily
due to the absence of Smith Barney from May 2009 onwards and the absence
of fourth-quarter revenue of Nikko Asset Management, partially offset by an
improvement in marks in Retail Alternative Investments. Revenues in the
prior year include a $347 million pretax gain on sale of CitiStreet and charges
related to the settlement of auction rate securities of $393 million pretax.
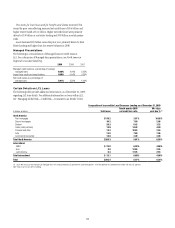
Operating expenses decreased 64% from the prior year, mainly driven
by the absence of Smith Barney and Nikko Asset Management expenses, re-
engineering efforts and the absence of 2008 one-time expenses ($0.9 billion
intangible impairment, $0.2 billion of restructuring and $0.5 billion of write-
downs and other charges).
Provisions for loan losses and for benefits and claims decreased 15%
mainly reflecting a $50 million decrease in provision for benefits and claims,
partially offset by increased reserve builds of $28 million.
Assets decreased 40% versus the prior year, mostly driven by the sales of
Nikko Cordial Securities and Nikko Asset Management ($25 billion) and the
managed futures business ($1.4 billion), partially offset by increased Smith
Barney assets of $4 billion.
2008 vs. 2007
Revenues, net of interest expense decreased 21% from the prior year
primarily due to lower transactional and investment revenues in Smith
Barney, lower revenues in Nikko Asset Management and higher markdowns
in Retail Alternative Investments.
Operating expenses increased 16% versus the prior year, mainly driven
by a $0.9 billion intangible impairment in Nikko Asset Management in the
fourth quarter of 2008, $0.2 billion of restructuring charges and $0.5 billion
of write-downs and other charges.
Provisions for loan losses and for benefits and claims increased $65
million compared to the prior year, mainly due to a $52 million increase in
provisions for benefits and claims.
Assets increased 4% versus the prior year.