Citibank 2009 Annual Report Download - page 245
Download and view the complete annual report
Please find page 245 of the 2009 Citibank annual report below. You can navigate through the pages in the report by either clicking on the pages listed below, or by using the keyword search tool below to find specific information within the annual report.-
 1
1 -
2
-
3
-
4
-
5
-
6
-
7
-
8
-
9
-
10
-
11
-
12
-
13
-
14
-
15
-
16
-
17
-
18
-
19
-
20
-
21
-
22
-
23
-
24
-
25
-
26
-
27
-
28
-
29
-
30
-
31
-
32
-
33
-
34
-
35
-
36
-
37
-
38
-
39
-
40
-
41
-
42
-
43
-
44
-
45
-
46
-
47
-
48
-
49
-
50
-
51
-
52
-
53
-
54
-
55
-
56
-
57
-
58
-
59
-
60
-
61
-
62
-
63
-
64
-
65
-
66
-
67
-
68
-
69
-
70
-
71
-
72
-
73
-
74
-
75
-
76
-
77
-
78
-
79
-
80
-
81
-
82
-
83
-
84
-
85
-
86
-
87
-
88
-
89
-
90
-
91
-
92
-
93
-
94
-
95
-
96
-
97
-
98
-
99
-
100
-
101
-
102
-
103
-
104
-
105
-
106
-
107
-
108
-
109
-
110
-
111
-
112
-
113
-
114
-
115
-
116
-
117
-
118
-
119
-
120
-
121
-
122
-
123
-
124
-
125
-
126
-
127
-
128
-
129
-
130
-
131
-
132
-
133
-
134
-
135
-
136
-
137
-
138
-
139
-
140
-
141
-
142
-
143
-
144
-
145
-
146
-
147
-
148
-
149
-
150
-
151
-
152
-
153
-
154
-
155
-
156
-
157
-
158
-
159
-
160
-
161
-
162
-
163
-
164
-
165
-
166
-
167
-
168
-
169
-
170
-
171
-
172
-
173
-
174
-
175
-
176
-
177
-
178
-
179
-
180
-
181
-
182
-
183
-
184
-
185
-
186
-
187
-
188
-
189
-
190
-
191
-
192
-
193
-
194
-
195
-
196
-
197
-
198
-
199
-
200
-
201
-
202
-
203
-
204
-
205
-
206
-
207
-
208
-
209
-
210
-
211
-
212
-
213
-
214
-
215
-
216
-
217
-
218
-
219
-
220
-
221
-
222
-
223
-
224
-
225
-
226
-
227
-
228
-
229
-
230
-
231
-
232
-
233
-
234
-
 235
235 -
 236
236 -
 237
237 -
 238
238 -
 239
239 -
 240
240 -
 241
241 -
 242
242 -
 243
243 -
 244
244 -
 245
245 -
 246
246 -
 247
247 -
 248
248 -
 249
249 -
 250
250 -
 251
251 -
 252
252 -
 253
253 -
 254
254 -
 255
255 -
256
-
257
-
258
-
259
-
260
-
261
-
262
-
263
-
264
-
265
-
266
-
267
-
268
-
269
-
270
-
271
-
272
-
273
-
274
-
275
-
276
-
277
-
278
-
279
-
280
-
281
-
282
-
283
-
284
 |
 |

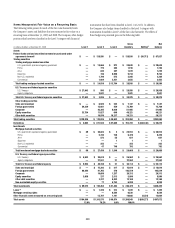
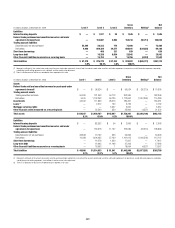
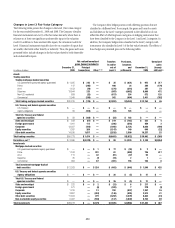
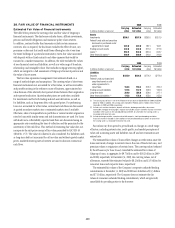
235
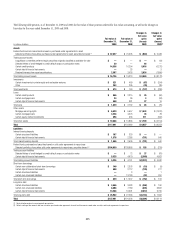
The following table presents, as of December 31, 2009 and 2008, the fair value of those positions selected for fair-value accounting, as well as the changes in
fair value for the years ended December 31, 2009 and 2008:
In millions of dollars
Fair value at
December 31,
2009
Fair value at
December 31,
2008
Changes in
fair value
gains
(losses)
2009
Changes in
fair value
gains
(losses)
2008(1)
Assets
Federal funds sold and securities borrowed or purchased under agreements to resell
Selected portfolios of securities purchased under agreements to resell, securities borrowed (2) $ 87,837 $ 70,305 $ (864) $ 2,438
Trading account assets
Legg Mason convertible preferred equity securities originally classified as available-for-sale $ — $ — $ — $ (13)
Selected letters of credit hedged by credit default swaps or participation notes 30 —64 —
Certain credit products 14,338 16,254 5,916 (6,272)
Certain hybrid financial instruments —33 —3
Retained interests from asset securitizations 2,357 3,026 2,024 (1,890)
Total trading account assets $ 16,725 $ 19,313 $ 8,004 $ (8,172)
Investments
Certain investments in private equity and real estate ventures $ 321 $ 469 $ (67) $ (254)
Other 253 295 (70) (35)
Total investments $ 574 $ 764 $ (137) $ (289)
Loans
Certain credit products $ 945 $ 2,315 $ 35 $ (60)
Certain mortgage loans 34 36 3(34)
Certain hybrid financial instruments 460 381 27 19
Total loans $ 1,439 $ 2,732 $ 65 $ (75)
Other assets
Mortgage servicing rights $ 6,530 $ 5,657 $ 1,543 $ (1,870)
Certain mortgage loans 3,338 4,273 35 78
Certain equity method investments 598 936 211 (362)
Total other assets $ 10,466 $ 10,866 $ 1,789 $ (2,154)
Total $117,041 $103,980 $ 8,857 $ (8,252)
Liabilities
Interest-bearing deposits
Certain structured liabilities $ 167 $ 320 $ — $ —
Certain hybrid financial instruments 1,378 2,286 (701) 640
Total interest-bearing deposits $ 1,545 $ 2,606 $ (701) $ 640
Federal funds purchased and securities loaned or sold under agreements to repurchase
Selected portfolios of securities sold under agreements to repurchase, securities loaned (2) $104,030 $138,866 $ 155 $ (319)
Trading account liabilities
Selected letters of credit hedged by credit default swaps or participation notes $ — $ 72 $ 37 $ (81)
Certain hybrid financial instruments 5,325 4,679 (2,360) 4,663
Total trading account liabilities $ 5,325 $ 4,751 $(2,323) $ 4,582
Short-term borrowings
Certain non-collateralized short-term borrowings $ 140 $ 2,303 $ (19) $ (9)
Certain hybrid financial instruments 499 2,112 (100) 277
Certain structured liabilities —3—1
Certain non-structured liabilities —13,189 (33) 250
Total short-term borrowings $ 639 $ 17,607 $ (152) $ 519
Long-term debt
Certain structured liabilities $ 3,666 $ 3,083 $ (268) $ 160
Certain non-structured liabilities 8,008 7,189 (303) 3,802
Certain hybrid financial instruments 14,268 16,991 (2,612) 3,730
Total long-term debt $ 25,942 $ 27,263 $(3,183) $ 7,692
Total $137,481 $191,093 $(6,204) $13,114
(1) Reclassified to conform to current period’s presentation.
(2) Reflects netting of the amounts due from securities purchased under agreements to resell and the amounts owed under securities sold under agreements to repurchase.