Citibank 2009 Annual Report Download - page 95
Download and view the complete annual report
Please find page 95 of the 2009 Citibank annual report below. You can navigate through the pages in the report by either clicking on the pages listed below, or by using the keyword search tool below to find specific information within the annual report.-
 1
1 -
2
-
3
-
4
-
5
-
6
-
7
-
8
-
9
-
10
-
11
-
12
-
13
-
14
-
15
-
16
-
17
-
18
-
19
-
20
-
21
-
22
-
23
-
24
-
25
-
26
-
27
-
28
-
29
-
30
-
31
-
32
-
33
-
34
-
35
-
36
-
37
-
38
-
39
-
40
-
41
-
42
-
43
-
44
-
45
-
46
-
47
-
48
-
49
-
50
-
51
-
52
-
53
-
54
-
55
-
56
-
57
-
58
-
59
-
60
-
61
-
62
-
63
-
64
-
65
-
66
-
67
-
68
-
69
-
70
-
71
-
72
-
73
-
74
-
75
-
76
-
77
-
78
-
79
-
80
-
81
-
82
-
83
-
84
-
 85
85 -
 86
86 -
 87
87 -
 88
88 -
 89
89 -
 90
90 -
 91
91 -
 92
92 -
 93
93 -
 94
94 -
 95
95 -
 96
96 -
 97
97 -
 98
98 -
 99
99 -
 100
100 -
 101
101 -
 102
102 -
 103
103 -
 104
104 -
 105
105 -
106
-
107
-
108
-
109
-
110
-
111
-
112
-
113
-
114
-
115
-
116
-
117
-
118
-
119
-
120
-
121
-
122
-
123
-
124
-
125
-
126
-
127
-
128
-
129
-
130
-
131
-
132
-
133
-
134
-
135
-
136
-
137
-
138
-
139
-
140
-
141
-
142
-
143
-
144
-
145
-
146
-
147
-
148
-
149
-
150
-
151
-
152
-
153
-
154
-
155
-
156
-
157
-
158
-
159
-
160
-
161
-
162
-
163
-
164
-
165
-
166
-
167
-
168
-
169
-
170
-
171
-
172
-
173
-
174
-
175
-
176
-
177
-
178
-
179
-
180
-
181
-
182
-
183
-
184
-
185
-
186
-
187
-
188
-
189
-
190
-
191
-
192
-
193
-
194
-
195
-
196
-
197
-
198
-
199
-
200
-
201
-
202
-
203
-
204
-
205
-
206
-
207
-
208
-
209
-
210
-
211
-
212
-
213
-
214
-
215
-
216
-
217
-
218
-
219
-
220
-
221
-
222
-
223
-
224
-
225
-
226
-
227
-
228
-
229
-
230
-
231
-
232
-
233
-
234
-
235
-
236
-
237
-
238
-
239
-
240
-
241
-
242
-
243
-
244
-
245
-
246
-
247
-
248
-
249
-
250
-
251
-
252
-
253
-
254
-
255
-
256
-
257
-
258
-
259
-
260
-
261
-
262
-
263
-
264
-
265
-
266
-
267
-
268
-
269
-
270
-
271
-
272
-
273
-
274
-
275
-
276
-
277
-
278
-
279
-
280
-
281
-
282
-
283
-
284
 |
 |

85
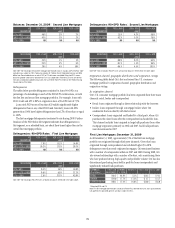
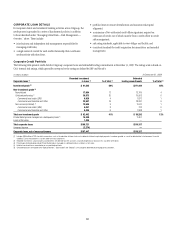
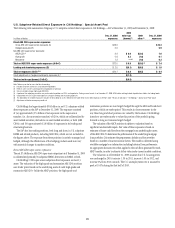
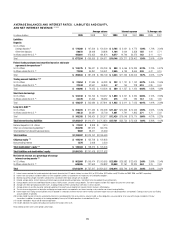
U.S. Subprime-Related Direct Exposure in Citi Holdings—Special Asset Pool
The following table summarizes Citigroup’s U.S. subprime-related direct exposures in Citi Holdings—SAP at December 31, 2009 and December 31, 2008:
In billions of dollars
Dec. 31, 2008
exposures
2009
write-ups
(downs) (1)
2009
other (2)
Dec. 31, 2009
exposures
Direct ABS CDO super-senior exposures:
Gross ABS CDO super-senior exposures (A) $18.9 $13.3
Hedged exposures (B) 6.9 5.9
Net ABS CDO super-senior exposures:
ABCP/CDO (3) 9.9 $ 0.6 $(3.6) 7.0
High grade 0.8 0.3 (1.0) 0.1
Mezzanine 1.3 — (4) (1.0) 0.3
Total net ABS CDO super-senior exposures (A-B=C) $12.0 $ 0.9 $(5.6) (4) $ 7.4
Lending and structuring exposures (D) $ 2.0 $(0.1) $(0.9 ) $ 1.0
Total net exposures (C+D) (5) (6) $14.1 $ 0.8 $(6.5) $ 8.4
Credit adjustment on hedged counterparty exposures (E) (7) $(1.3)
Total net write-ups (downs) (C+D+E) $(0.5)
Note: Table may not foot or cross-foot due to rounding.
(1) Includes net profits and losses associated with liquidations.
(2) Reflects sales, transfers and repayment or liquidations of principal.
(3) Consists of older-vintage, high-grade ABS CDOs.
(4) A portion of the underlying securities was purchased in liquidations of CDOs and reported as Trading account assets. As of December 31, 2009, $235 million relating to deals liquidated was held in the trading books.
(5) Composed of net CDO super-senior exposures and gross lending and structuring exposures.
(6) This $8.4 billion in net direct exposures includes the $7.3 billion of assets reflected in the table titled “Assets Within Special Asset Pool” under “Results of Operations—Citi Holdings—Special Asset Pool” above.
(7) Adjustment related to counterparty credit risk.
Citi Holdings had approximately $8.4 billion in net U.S. subprime-related
direct exposures in the SAP at December 31, 2009. The exposure consisted
of (a) approximately $7.4 billion of net exposures in the super-senior
tranches (i.e., the most senior tranches) of CDOs, which are collateralized by
asset-backed securities, derivatives on asset-backed securities, or both (ABS
CDOs), and (b) approximately $1.0 billion of exposures in its lending and
structuring business.
The SAP also has trading positions, both long and short, in U.S. subprime
RMBS and related products, including ABS CDOs, which are not included in
the figures above. The exposure from these positions is actively managed and
hedged, although the effectiveness of the hedging products used may vary
with material changes in market conditions.
Direct ABS CDO super-senior exposures
The net $7.4 billion in ABS CDO super-senior exposures as of December 31, 2009
is collateralized primarily by subprime RMBS, derivatives on RMBS, or both.
Citi Holdings’ CDO super-senior subprime direct exposures are Level 3
assets. The valuation of the high-grade and mezzanine ABS CDO positions
uses trader prices based on the underlying assets of each high-grade and
mezzanine ABS CDO. Unlike the ABCP positions, the high-grade and
mezzanine positions are now largely hedged through the ABX and bond short
positions, which are trader priced. This results in closer symmetry in the
way these long and short positions are valued by the business. Citi Holdings
intends to use trader marks to value this portion of the portfolio going
forward so long as it remains largely hedged.
The valuation of the ABCP positions is subject to valuation based on
significant unobservable inputs. Fair value of these exposures is based on
estimates of future cash flows from the mortgage loans underlying the assets
of the ABS CDOs. To determine the performance of the underlying mortgage
loan portfolios, Citi estimates the prepayments, defaults and loss severities
based on a number of macroeconomic factors. The model is calibrated using
available mortgage loan information including historical loan performance.
An appropriate discount rate is then applied to the cash flows generated for each
ABCP tranche, in order to estimate its fair value under current market conditions.
The valuation as of December 31, 2009 assumes that U.S. housing prices
are unchanged in 2010, increase 1.1% in 2011, increase 1.4% in 2012, and
increase 3% from 2013 onwards. The U.S. unemployment rate is assumed to
peak at 10.3% during the first half of 2010.