Citibank 2009 Annual Report Download - page 40
Download and view the complete annual report
Please find page 40 of the 2009 Citibank annual report below. You can navigate through the pages in the report by either clicking on the pages listed below, or by using the keyword search tool below to find specific information within the annual report.-
 1
1 -
2
-
3
-
4
-
5
-
6
-
7
-
8
-
9
-
10
-
11
-
12
-
13
-
14
-
15
-
16
-
17
-
18
-
19
-
20
-
21
-
22
-
23
-
24
-
25
-
26
-
27
-
28
-
29
-
 30
30 -
 31
31 -
 32
32 -
 33
33 -
 34
34 -
 35
35 -
 36
36 -
 37
37 -
 38
38 -
 39
39 -
 40
40 -
 41
41 -
 42
42 -
 43
43 -
 44
44 -
 45
45 -
 46
46 -
 47
47 -
 48
48 -
 49
49 -
 50
50 -
51
-
52
-
53
-
54
-
55
-
56
-
57
-
58
-
59
-
60
-
61
-
62
-
63
-
64
-
65
-
66
-
67
-
68
-
69
-
70
-
71
-
72
-
73
-
74
-
75
-
76
-
77
-
78
-
79
-
80
-
81
-
82
-
83
-
84
-
85
-
86
-
87
-
88
-
89
-
90
-
91
-
92
-
93
-
94
-
95
-
96
-
97
-
98
-
99
-
100
-
101
-
102
-
103
-
104
-
105
-
106
-
107
-
108
-
109
-
110
-
111
-
112
-
113
-
114
-
115
-
116
-
117
-
118
-
119
-
120
-
121
-
122
-
123
-
124
-
125
-
126
-
127
-
128
-
129
-
130
-
131
-
132
-
133
-
134
-
135
-
136
-
137
-
138
-
139
-
140
-
141
-
142
-
143
-
144
-
145
-
146
-
147
-
148
-
149
-
150
-
151
-
152
-
153
-
154
-
155
-
156
-
157
-
158
-
159
-
160
-
161
-
162
-
163
-
164
-
165
-
166
-
167
-
168
-
169
-
170
-
171
-
172
-
173
-
174
-
175
-
176
-
177
-
178
-
179
-
180
-
181
-
182
-
183
-
184
-
185
-
186
-
187
-
188
-
189
-
190
-
191
-
192
-
193
-
194
-
195
-
196
-
197
-
198
-
199
-
200
-
201
-
202
-
203
-
204
-
205
-
206
-
207
-
208
-
209
-
210
-
211
-
212
-
213
-
214
-
215
-
216
-
217
-
218
-
219
-
220
-
221
-
222
-
223
-
224
-
225
-
226
-
227
-
228
-
229
-
230
-
231
-
232
-
233
-
234
-
235
-
236
-
237
-
238
-
239
-
240
-
241
-
242
-
243
-
244
-
245
-
246
-
247
-
248
-
249
-
250
-
251
-
252
-
253
-
254
-
255
-
256
-
257
-
258
-
259
-
260
-
261
-
262
-
263
-
264
-
265
-
266
-
267
-
268
-
269
-
270
-
271
-
272
-
273
-
274
-
275
-
276
-
277
-
278
-
279
-
280
-
281
-
282
-
283
-
284
 |
 |

30
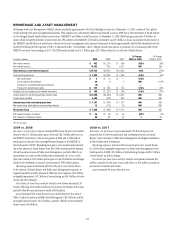
CITI HOLDINGS
Citi Holdings contains businesses and portfolios of assets that Citigroup has determined are not central to its core Citicorp business. These noncore businesses
tend to be more asset-intensive and reliant on wholesale funding and also may be product-driven rather than client-driven. Citi intends to exit these businesses
as quickly as practicable yet in an economically rational manner through business divestitures, portfolio run-off and asset sales. Citi has made substantial
progress divesting and exiting businesses from Citi Holdings, having completed 15 divestitures in 2009, including Smith Barney, Nikko Cordial Securities, Nikko
Asset Management Financial Institution Credit Card business (FI) and Diners Club North America. Citi Holdings’ assets have been reduced by nearly 40%, or
$351 billion, from the peak level of $898 billion in the first quarter of 2008 to $547 billion at year-end 2009. Citi Holdings’ assets represented less than 30% of
Citi’s assets as of December 31, 2009. Asset reductions from Citi Holdings have the combined benefits of further fortifying Citigroup’s capital base, lowering risk,
simplifying the organization and allowing Citi to allocate capital to fund long-term strategic businesses.
Citi Holdings consists of the following businesses: Brokerage and Asset Management; Local Consumer Lending; and Special Asset Pool.
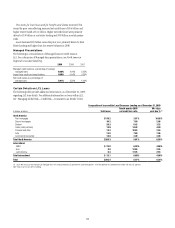
With Citi’s exit from the loss-sharing agreement with the U.S. government in December 2009, the Company conducted a broad review of the Citi Holdings
asset base to determine which assets are strategically important to Citicorp. As a result of this analysis, approximately $61 billion of assets will be moved from
Citi Holdings into Citicorp in the first quarter of 2010. The assets consist primarily of approximately $34 billion of U.S. mortgages that will be transferred to NA
RCB, approximately $19 billion of commercial and corporate loans and securities related to core Citicorp clients, of which approximately $17 billion will be
moved to S&B and the remainder to NA RCB, and approximately $5.0 billion of assets related to Citi’s Mexico asset management business that will be moved to
LATAM RCB.
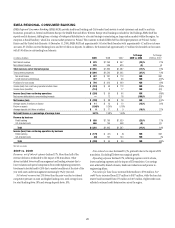
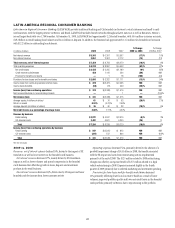
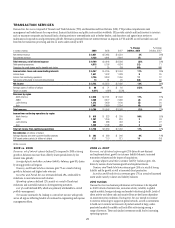
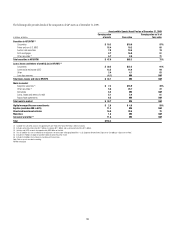
In millions of dollars 2009 2008 2007
% Change
2009 vs. 2008
% Change
2008 vs. 2007
Net interest revenue $ 17,314 $ 22,459 $ 21,797 (23)% 3%
Non-interest revenue 13,321 (29,157) (2,284) NM NM
Total revenues, net of interest expense $ 30,635 $ (6,698) $ 19,513 NM NM
Provisions for credit losses and for benefits and claims
Net credit losses $ 24,660 $ 14,070 $ 7,230 75% 95%
Credit reserve build 5,457 11,444 5,836 (52) 96
Provision for loan losses $ 30,117 $ 25,514 $ 13,066 18% 95%
Provision for benefits and claims 1,210 1,396 919 (13)52
Provision for unfunded lending commitments 109 (172) 71 NM NM
Total provisions for credit losses and for benefits and claims $ 31,436 $ 26,738 $ 14,056 18% 90%
Total operating expenses $ 14,677 $ 25,197 $ 20,487 (42)% 23%
(Loss) from continuing operations before taxes $ (15,478) $ (58,633) $ (15,030) 74% NM
Benefits for income taxes (7,239) (22,621) (6,338) 68 NM
Income (loss) from continuing operations $ (8,239) $ (36,012) $ (8,692) 77% NM
Net income attributable to noncontrolling interests 27 (372) 218 NM NM
Citi Holdings net (loss) $ (8,266) $ (35,640) $ (8,910) 77% NM
Balance sheet data (in billions of dollars)
Total EOP assets $ 547 $ 715 $ 888 (23)% (19)%
Total EOP deposits $ 92 $ 83 $ 79 11% 5%
NM Not meaningful