Citibank 2009 Annual Report Download - page 160
Download and view the complete annual report
Please find page 160 of the 2009 Citibank annual report below. You can navigate through the pages in the report by either clicking on the pages listed below, or by using the keyword search tool below to find specific information within the annual report.-
 1
1 -
2
-
3
-
4
-
5
-
6
-
7
-
8
-
9
-
10
-
11
-
12
-
13
-
14
-
15
-
16
-
17
-
18
-
19
-
20
-
21
-
22
-
23
-
24
-
25
-
26
-
27
-
28
-
29
-
30
-
31
-
32
-
33
-
34
-
35
-
36
-
37
-
38
-
39
-
40
-
41
-
42
-
43
-
44
-
45
-
46
-
47
-
48
-
49
-
50
-
51
-
52
-
53
-
54
-
55
-
56
-
57
-
58
-
59
-
60
-
61
-
62
-
63
-
64
-
65
-
66
-
67
-
68
-
69
-
70
-
71
-
72
-
73
-
74
-
75
-
76
-
77
-
78
-
79
-
80
-
81
-
82
-
83
-
84
-
85
-
86
-
87
-
88
-
89
-
90
-
91
-
92
-
93
-
94
-
95
-
96
-
97
-
98
-
99
-
100
-
101
-
102
-
103
-
104
-
105
-
106
-
107
-
108
-
109
-
110
-
111
-
112
-
113
-
114
-
115
-
116
-
117
-
118
-
119
-
120
-
121
-
122
-
123
-
124
-
125
-
126
-
127
-
128
-
129
-
130
-
131
-
132
-
133
-
134
-
135
-
136
-
137
-
138
-
139
-
140
-
141
-
142
-
143
-
144
-
145
-
146
-
147
-
148
-
149
-
 150
150 -
 151
151 -
 152
152 -
 153
153 -
 154
154 -
 155
155 -
 156
156 -
 157
157 -
 158
158 -
 159
159 -
 160
160 -
 161
161 -
 162
162 -
 163
163 -
 164
164 -
 165
165 -
 166
166 -
 167
167 -
 168
168 -
 169
169 -
 170
170 -
171
-
172
-
173
-
174
-
175
-
176
-
177
-
178
-
179
-
180
-
181
-
182
-
183
-
184
-
185
-
186
-
187
-
188
-
189
-
190
-
191
-
192
-
193
-
194
-
195
-
196
-
197
-
198
-
199
-
200
-
201
-
202
-
203
-
204
-
205
-
206
-
207
-
208
-
209
-
210
-
211
-
212
-
213
-
214
-
215
-
216
-
217
-
218
-
219
-
220
-
221
-
222
-
223
-
224
-
225
-
226
-
227
-
228
-
229
-
230
-
231
-
232
-
233
-
234
-
235
-
236
-
237
-
238
-
239
-
240
-
241
-
242
-
243
-
244
-
245
-
246
-
247
-
248
-
249
-
250
-
251
-
252
-
253
-
254
-
255
-
256
-
257
-
258
-
259
-
260
-
261
-
262
-
263
-
264
-
265
-
266
-
267
-
268
-
269
-
270
-
271
-
272
-
273
-
274
-
275
-
276
-
277
-
278
-
279
-
280
-
281
-
282
-
283
-
284
 |
 |

150
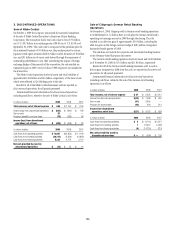
7. PRINCIPAL TRANSACTIONS
Principal transactions revenue consists of realized and unrealized gains
and losses from trading activities. Trading activities include revenues from
fixed income, equities, credit and commodities products, as well as foreign
exchange transactions. Not included in the table below is the impact of
net interest revenue related to trading activities, which is an integral part
of trading activities’ profitability. The following table presents principal
transactions revenue for the years ended December 31:
In millions of dollars 2009 2008 2007
Regional Consumer Banking $ 911 $ 149 $ 592
Institutional Clients Group 6,194 6,498 6,324
Subtotal Citicorp $ 7,105 6,647 6,916
Local Consumer Lending (449) 1,520 773
Brokerage and Asset Management 33 (4,958) 172
Special Asset Pool (3,112) (26,714) (20,719)
Subtotal Citi Holdings $(3,528) (30,152) (19,774)
Corporate/Other 355 904 511
Total Citigroup $ 3,932 $(22,601) $(12,347)
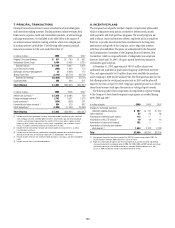
In millions of dollars 2009 2008 2007
Interest rate contracts (1) $ 4,075 $ (9,081) 159
Foreign exchange contracts (2) 2,762 3,921 2,573
Equity contracts (3) (334) (958) 521
Commodity and other contracts (4) 924 970 662
Credit derivatives (5) (3,495) (17,453) (16,262)
Total Citigroup $ 3,932 $(22,601) $(12,347)
(1) Includes revenues from government securities and corporate debt, municipal securities, preferred
stock, mortgage securities, and other debt instruments. Also includes spot and forward trading of
currencies and exchange-traded and over-the-counter (OTC) currency options, options on fixed
income securities, interest rate swaps, currency swaps, swap options, caps and floors, financial
futures, OTC options, and forward contracts on fixed income securities.
(2) Includes revenues from foreign exchange spot, forward, option and swap contracts, as well as
translation gains and losses.
(3) Includes revenues from common, preferred and convertible preferred stock, convertible corporate
debt, equity-linked notes, and exchange-traded and OTC equity options and warrants.
(4) Primarily includes revenues from crude oil, refined oil products, natural gas, and other commodities
trades.
(5) Includes revenues from structured credit products.
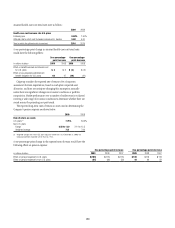
8. INCENTIVE PLANS
The Company has adopted a number of equity compensation plans under
which it administers stock options, restricted or deferred stock awards,
stock payments and stock purchase programs. The award programs are
used to attract, retain and motivate officers, employees and non-employee
directors, to provide incentives for their contributions to the long-term
performance and growth of the Company, and to align their interests
with those of stockholders. The plans are administered by the Personnel
and Compensation Committee of the Citigroup Board of Directors (the
Committee), which is composed entirely of independent non-employee
directors. Since April 19, 2005, all equity awards have been pursuant to
stockholder-approved plans.
At December 31, 2009, approximately 580.33 million shares were
authorized and available for grant under Citigroup’s 2009 Stock Incentive
Plan, and approximately 66.45 million shares were available for purchase
under Citigroup’s 2000 Stock Purchase Plan. The final purchase date for the
last offering under the stock purchase plan was in 2005 and the plan will
expire by its terms on April 30, 2010. Citigroup’s general practice is to deliver
shares from treasury stock upon the exercise or vesting of equity awards.
The following table shows components of compensation expense relating
to the Company’s stock-based compensation programs as recorded during
2009, 2008 and 2007:
In millions of dollars 2009 2008 2007
Charges for estimated awards to
retirement-eligible employees $ 207 $ 110 $ 467
Option expense 55 29 86
Amortization of deferred cash awards 113 — —
Amortization of MC LTIP awards (1) 19 18 18
Amortization of salary stock awards 162 — —
Amortization of restricted and deferred
stock awards (2) 1,543 3,133 2,728
Total $2,099 $3,290 $3,299
(1) Management Committee Long-Term Incentive Plan (MC LTIP) awards were granted in 2007. The
awards expired in December 2009 without the issuance of shares.
(2) Represents amortization of expense over the remaining life of all unvested restricted and deferred
stock awards granted to all employees prior to 2006. The 2009, 2008 and 2007 periods also include
amortization expense for all unvested awards to non-retirement-eligible employees on or after
January 1, 2006. Amortization includes estimated forfeitures of awards.