Citibank 2009 Annual Report Download - page 194
Download and view the complete annual report
Please find page 194 of the 2009 Citibank annual report below. You can navigate through the pages in the report by either clicking on the pages listed below, or by using the keyword search tool below to find specific information within the annual report.-
 1
1 -
2
-
3
-
4
-
5
-
6
-
7
-
8
-
9
-
10
-
11
-
12
-
13
-
14
-
15
-
16
-
17
-
18
-
19
-
20
-
21
-
22
-
23
-
24
-
25
-
26
-
27
-
28
-
29
-
30
-
31
-
32
-
33
-
34
-
35
-
36
-
37
-
38
-
39
-
40
-
41
-
42
-
43
-
44
-
45
-
46
-
47
-
48
-
49
-
50
-
51
-
52
-
53
-
54
-
55
-
56
-
57
-
58
-
59
-
60
-
61
-
62
-
63
-
64
-
65
-
66
-
67
-
68
-
69
-
70
-
71
-
72
-
73
-
74
-
75
-
76
-
77
-
78
-
79
-
80
-
81
-
82
-
83
-
84
-
85
-
86
-
87
-
88
-
89
-
90
-
91
-
92
-
93
-
94
-
95
-
96
-
97
-
98
-
99
-
100
-
101
-
102
-
103
-
104
-
105
-
106
-
107
-
108
-
109
-
110
-
111
-
112
-
113
-
114
-
115
-
116
-
117
-
118
-
119
-
120
-
121
-
122
-
123
-
124
-
125
-
126
-
127
-
128
-
129
-
130
-
131
-
132
-
133
-
134
-
135
-
136
-
137
-
138
-
139
-
140
-
141
-
142
-
143
-
144
-
145
-
146
-
147
-
148
-
149
-
150
-
151
-
152
-
153
-
154
-
155
-
156
-
157
-
158
-
159
-
160
-
161
-
162
-
163
-
164
-
165
-
166
-
167
-
168
-
169
-
170
-
171
-
172
-
173
-
174
-
175
-
176
-
177
-
178
-
179
-
180
-
181
-
182
-
183
-
 184
184 -
 185
185 -
 186
186 -
 187
187 -
 188
188 -
 189
189 -
 190
190 -
 191
191 -
 192
192 -
 193
193 -
 194
194 -
 195
195 -
 196
196 -
 197
197 -
 198
198 -
 199
199 -
 200
200 -
 201
201 -
 202
202 -
 203
203 -
 204
204 -
205
-
206
-
207
-
208
-
209
-
210
-
211
-
212
-
213
-
214
-
215
-
216
-
217
-
218
-
219
-
220
-
221
-
222
-
223
-
224
-
225
-
226
-
227
-
228
-
229
-
230
-
231
-
232
-
233
-
234
-
235
-
236
-
237
-
238
-
239
-
240
-
241
-
242
-
243
-
244
-
245
-
246
-
247
-
248
-
249
-
250
-
251
-
252
-
253
-
254
-
255
-
256
-
257
-
258
-
259
-
260
-
261
-
262
-
263
-
264
-
265
-
266
-
267
-
268
-
269
-
270
-
271
-
272
-
273
-
274
-
275
-
276
-
277
-
278
-
279
-
280
-
281
-
282
-
283
-
284
 |
 |
184
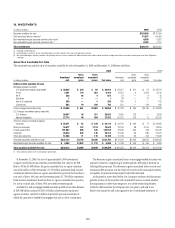
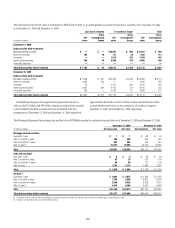
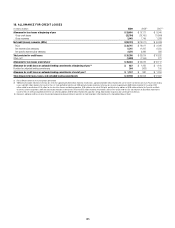
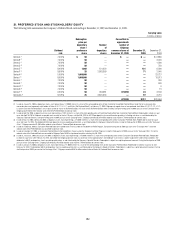
In addition, included in the loan table are purchased distressed loans,
which are loans that have evidenced significant credit deterioration
subsequent to origination but prior to acquisition by Citigroup. In
accordance with SOP 03-3, the difference between the total expected cash
flows for these loans and the initial recorded investments is recognized in
income over the life of the loans using a level yield. Accordingly, these loans
have been excluded from the impaired loan information presented above.
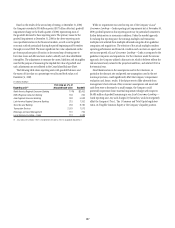
In addition, per SOP 03-3, subsequent decreases to the expected cash flows
for a purchased distressed loan require a build of an allowance so the loan
retains its level yield. However, increases in the expected cash flows are first
recognized as a reduction of any previously established allowance and then
recognized as income prospectively over the remaining life of the loan by
increasing the loan’s level yield. Where the expected cash flows cannot be
reliably estimated, the purchased distressed loan is accounted for under the
cost recovery method.
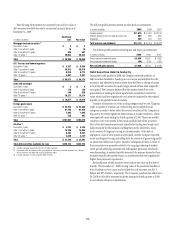
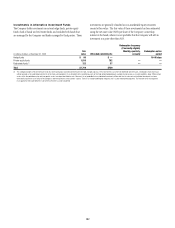
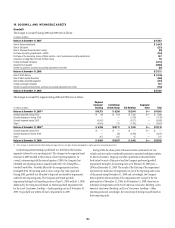
The carrying amount of the purchased distressed loan portfolio at
December 31, 2009 was $825 million net of an allowance of $95 million.
The changes in the accretable yield, related allowance and carrying amount net of accretable yield for 2009 are as follows:
In millions of dollars
Accretable
yield
Carrying
amount of loan
receivable Allowance
Beginning balance $ 92 $1,510 $122
Purchases (1) 14 329 —
Disposals/payments received (5) (967) —
Accretion (52) 52 —
Builds (reductions) to the allowance (21) 1 (27)
Increase to expected cash flows 10 2 —
FX/Other (11) (7) —
Balance, December 31, 2009 (2) $ 27 $ 920 $ 95
(1) The balance reported in the column “Carrying amount of loan receivable” consists of $87 million of purchased loans accounted for under the level-yield method and $242 million under the cost-recovery method. These
balances represent the fair value of these loans at their acquisition date. The related total expected cash flows for the level-yield loans were $101 million at their acquisition dates.
(2) The balance reported in the column “Carrying amount of loan receivable” consists of $561 million of loans accounted for under the level-yield method and $359 million accounted for under the cost-recovery method.