Citibank 2009 Annual Report Download - page 38
Download and view the complete annual report
Please find page 38 of the 2009 Citibank annual report below. You can navigate through the pages in the report by either clicking on the pages listed below, or by using the keyword search tool below to find specific information within the annual report.-
 1
1 -
2
-
3
-
4
-
5
-
6
-
7
-
8
-
9
-
10
-
11
-
12
-
13
-
14
-
15
-
16
-
17
-
18
-
19
-
20
-
21
-
22
-
23
-
24
-
25
-
26
-
27
-
 28
28 -
 29
29 -
 30
30 -
 31
31 -
 32
32 -
 33
33 -
 34
34 -
 35
35 -
 36
36 -
 37
37 -
 38
38 -
 39
39 -
 40
40 -
 41
41 -
 42
42 -
 43
43 -
 44
44 -
 45
45 -
 46
46 -
 47
47 -
 48
48 -
49
-
50
-
51
-
52
-
53
-
54
-
55
-
56
-
57
-
58
-
59
-
60
-
61
-
62
-
63
-
64
-
65
-
66
-
67
-
68
-
69
-
70
-
71
-
72
-
73
-
74
-
75
-
76
-
77
-
78
-
79
-
80
-
81
-
82
-
83
-
84
-
85
-
86
-
87
-
88
-
89
-
90
-
91
-
92
-
93
-
94
-
95
-
96
-
97
-
98
-
99
-
100
-
101
-
102
-
103
-
104
-
105
-
106
-
107
-
108
-
109
-
110
-
111
-
112
-
113
-
114
-
115
-
116
-
117
-
118
-
119
-
120
-
121
-
122
-
123
-
124
-
125
-
126
-
127
-
128
-
129
-
130
-
131
-
132
-
133
-
134
-
135
-
136
-
137
-
138
-
139
-
140
-
141
-
142
-
143
-
144
-
145
-
146
-
147
-
148
-
149
-
150
-
151
-
152
-
153
-
154
-
155
-
156
-
157
-
158
-
159
-
160
-
161
-
162
-
163
-
164
-
165
-
166
-
167
-
168
-
169
-
170
-
171
-
172
-
173
-
174
-
175
-
176
-
177
-
178
-
179
-
180
-
181
-
182
-
183
-
184
-
185
-
186
-
187
-
188
-
189
-
190
-
191
-
192
-
193
-
194
-
195
-
196
-
197
-
198
-
199
-
200
-
201
-
202
-
203
-
204
-
205
-
206
-
207
-
208
-
209
-
210
-
211
-
212
-
213
-
214
-
215
-
216
-
217
-
218
-
219
-
220
-
221
-
222
-
223
-
224
-
225
-
226
-
227
-
228
-
229
-
230
-
231
-
232
-
233
-
234
-
235
-
236
-
237
-
238
-
239
-
240
-
241
-
242
-
243
-
244
-
245
-
246
-
247
-
248
-
249
-
250
-
251
-
252
-
253
-
254
-
255
-
256
-
257
-
258
-
259
-
260
-
261
-
262
-
263
-
264
-
265
-
266
-
267
-
268
-
269
-
270
-
271
-
272
-
273
-
274
-
275
-
276
-
277
-
278
-
279
-
280
-
281
-
282
-
283
-
284
 |
 |

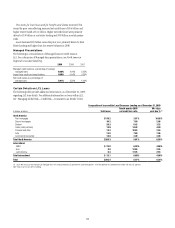
28
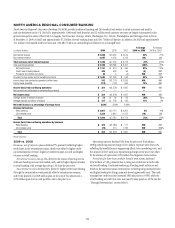
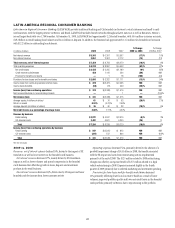
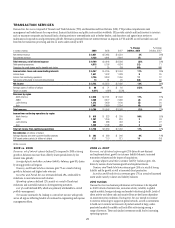
2009 vs. 2008
Revenues, net of interest expense increased 11% or $2.7 billion, as markets
began to recover in the early part of 2009, bringing back higher levels of
volume activity and higher levels of liquidity, which began to decline again
in the third quarter of 2009. The growth in revenue in the early part of the
year was mainly due to a $7.1 billion increase in fixed income markets,
reflecting strong trading opportunities across all asset classes in the first half
of 2009, and a $1.5 billion increase in investment banking revenue primarily
from increases in debt and equity underwriting activities reflecting higher
transaction volumes from depressed 2008 levels. These increases were offset
by a $6.4 billion decrease in lending revenue primarily from losses on credit
default swap hedges. Excluding the 2009 and 2008 CVA impact, as indicated
in the table below, revenues increased 23% or $5.5 billion.
Operating expenses decreased 17%, or $2.7 billion. Excluding the 2008
repositioning and restructuring charges and the 2009 litigation reserve
release, operating expenses declined 11% or $1.6 billion, mainly as a result of
headcount reductions and benefits from expense management.
Provisions for loan losses and for benefits and claims decreased 7% or
$129 million, to $1.7 billion, mainly due to lower credit reserve builds and
net credit losses, due to an improved credit environment, particularly in the
latter part of the year.
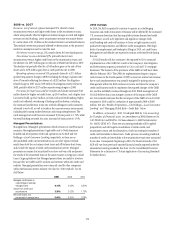
2008 vs. 2007
Revenues, net of interest expense decreased 2% or $0.4 billion reflecting
the overall difficult market conditions. Excluding the 2008 and 2007 CVA
impact, revenues decreased 3% or $0.6 billion. The reduction in revenue was
primarily due to a decrease in investment banking revenue of $2.3 billion
to $3.2 billion, mainly in debt and equity underwriting, reflecting lower
volumes, and a decrease in equity markets revenue of $2.3 billion to $2.9
billion due to extremely high volatility and reduced levels of activity. These
reductions were offset by an increase in fixed income markets of $2.9 billion
to $14.4 billion due to strong performance in interest rates and currencies,
and an increase in lending revenue of $2.4 billion to $4.2 billion mainly
from gains on credit default swap hedges.
Operating expenses decreased by 2% or $0.4 billion. Excluding the 2008
and 2007 repositioning and restructuring charges and the 2007 litigation
reserve reversal, operating expenses decreased by 7% or $1.1 billion driven by
headcount reduction and lower performance-based incentives.
Provisions for credit losses and for benefits and claims increased $1.3
billion to $1.8 billion mainly from higher credit reserve builds and net credit
losses offset by a lower provision for unfunded lending commitments due to
deterioration in the credit environment.
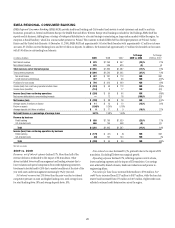
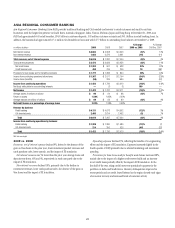
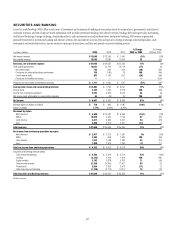
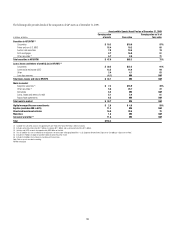
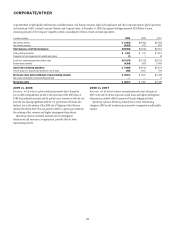
Certain Revenues Impacting Securities and Banking
Items that impacted S&B revenues during 2009 and 2008 are set forth in the
table below.
Pretax revenue
In millions of dollars 2009 2008
Private equity and equity investments $ 201 $ (377)
Alt-A mortgages (1) (2) 321 (737)
Commercial real estate (CRE) positions (1) (3) 68 270
CVA on Citi debt liabilities under fair value option (3,974) 4,325
CVA on derivatives positions, excluding monoline insurers 2,204 (3,292)
Total significant revenue items $(1,180) $ 189
(1) Net of hedges.
(2) For these purposes, Alt-A mortgage securities are non-agency residential mortgage-backed securities
(RMBS) where (i) the underlying collateral has weighted average FICO scores between 680 and 720 or
(ii) for instances where FICO scores are greater than 720, RMBS have 30% or less of the underlying
collateral composed of full documentation loans. See “Managing Global Risk—Credit Risk—U.S.
Consumer Mortgage Lending.”
(3) S&B’s commercial real estate exposure is split into three categories of assets: held at fair value; held-
to-maturity/held-for-investment; and equity. See “Managing Global Risk—Credit Risk—Exposure to
Commercial Real Estate” section for a further discussion.
In the table above, 2009 includes a $330 million pretax adjustment
to the CVA balance, which reduced pretax revenues for the year, reflecting
a correction of an error related to prior periods. See “Significant
Accounting Policies and Significant Estimates” below and Notes 1 and 34
to the Consolidated Financial Statements for a further discussion of this
adjustment.
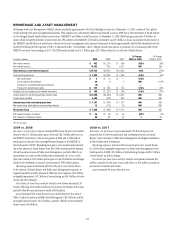
2010 Outlook
The 2010 outlook for S&B will depend on the level of client activity and on
macroeconomic conditions, market valuations and volatility, interest rates
and other market factors. Management of S&B currently expects to maintain
client activity throughout 2010 and to operate in market conditions that offer
moderate volatility and increased liquidity.
Operating expenses will benefit from continued re-engineering and
expense management initiatives, but will be offset by investments in talent
and infrastructure to support growth.