Citibank 2009 Annual Report Download - page 17
Download and view the complete annual report
Please find page 17 of the 2009 Citibank annual report below. You can navigate through the pages in the report by either clicking on the pages listed below, or by using the keyword search tool below to find specific information within the annual report.-
 1
1 -
2
-
3
-
4
-
5
-
6
-
 7
7 -
 8
8 -
 9
9 -
 10
10 -
 11
11 -
 12
12 -
 13
13 -
 14
14 -
 15
15 -
 16
16 -
 17
17 -
 18
18 -
 19
19 -
 20
20 -
 21
21 -
 22
22 -
 23
23 -
 24
24 -
 25
25 -
 26
26 -
 27
27 -
28
-
29
-
30
-
31
-
32
-
33
-
34
-
35
-
36
-
37
-
38
-
39
-
40
-
41
-
42
-
43
-
44
-
45
-
46
-
47
-
48
-
49
-
50
-
51
-
52
-
53
-
54
-
55
-
56
-
57
-
58
-
59
-
60
-
61
-
62
-
63
-
64
-
65
-
66
-
67
-
68
-
69
-
70
-
71
-
72
-
73
-
74
-
75
-
76
-
77
-
78
-
79
-
80
-
81
-
82
-
83
-
84
-
85
-
86
-
87
-
88
-
89
-
90
-
91
-
92
-
93
-
94
-
95
-
96
-
97
-
98
-
99
-
100
-
101
-
102
-
103
-
104
-
105
-
106
-
107
-
108
-
109
-
110
-
111
-
112
-
113
-
114
-
115
-
116
-
117
-
118
-
119
-
120
-
121
-
122
-
123
-
124
-
125
-
126
-
127
-
128
-
129
-
130
-
131
-
132
-
133
-
134
-
135
-
136
-
137
-
138
-
139
-
140
-
141
-
142
-
143
-
144
-
145
-
146
-
147
-
148
-
149
-
150
-
151
-
152
-
153
-
154
-
155
-
156
-
157
-
158
-
159
-
160
-
161
-
162
-
163
-
164
-
165
-
166
-
167
-
168
-
169
-
170
-
171
-
172
-
173
-
174
-
175
-
176
-
177
-
178
-
179
-
180
-
181
-
182
-
183
-
184
-
185
-
186
-
187
-
188
-
189
-
190
-
191
-
192
-
193
-
194
-
195
-
196
-
197
-
198
-
199
-
200
-
201
-
202
-
203
-
204
-
205
-
206
-
207
-
208
-
209
-
210
-
211
-
212
-
213
-
214
-
215
-
216
-
217
-
218
-
219
-
220
-
221
-
222
-
223
-
224
-
225
-
226
-
227
-
228
-
229
-
230
-
231
-
232
-
233
-
234
-
235
-
236
-
237
-
238
-
239
-
240
-
241
-
242
-
243
-
244
-
245
-
246
-
247
-
248
-
249
-
250
-
251
-
252
-
253
-
254
-
255
-
256
-
257
-
258
-
259
-
260
-
261
-
262
-
263
-
264
-
265
-
266
-
267
-
268
-
269
-
270
-
271
-
272
-
273
-
274
-
275
-
276
-
277
-
278
-
279
-
280
-
281
-
282
-
283
-
284
 |
 |
7
MANAGEMENT’S DISCUSSION AND ANALYSIS OF FINANCIAL CONDITION AND
RESULTS OF OPERATIONS
EXECUTIVE SUMMARY
Introduction
Citigroup is a global diversified financial services holding company
whose businesses provide consumers, corporations, governments and
institutions with a broad range of financial products and services, including
consumer banking, credit cards, corporate and investment banking,
securities brokerage and wealth management. Citigroup has approximately
200 million customer accounts and does business in more than 140
countries.
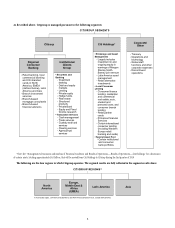
In response to the dramatic and profound changes in the market
environment that became increasingly apparent through 2008, in early 2009,
Citigroup decided to increase the focus on its core businesses and reorganized
into three business segments for management and reporting purposes:
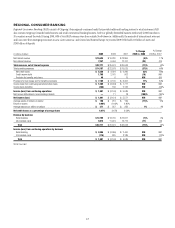
Citicorp (Regional Consumer Banking and Institutional Clients Group);
Citi Holdings (Brokerage and Asset Management, Local Consumer
Lending, and Special Asset Pool); and Corporate/Other (Treasury, corporate
expenses). Citi believes the realignment allows it to enhance the capabilities
and performance of Citigroup’s core assets, through Citicorp, as well as to
tighten its focus on risk management and reduce and realize value from its
non-core assets, through Citi Holdings.
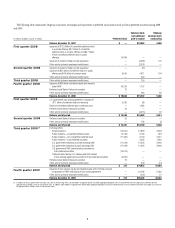
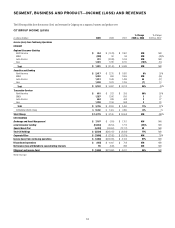
Citigroup reported a net loss for 2009 of $1.6 billion, as compared to a $27.7
billion loss in 2008. Diluted EPS was a loss of $0.80 per share in 2009, versus
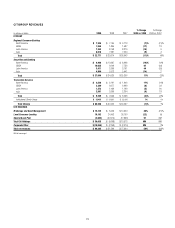
a loss of $5.63 per share in 2008, and net revenue was $80.3 billion in 2009,
versus $51.6 billion in 2008. Net interest revenue declined by $4.8 billion to
$48.9 billion in 2009, generally as a result of lower average interest-earning
assets, as the company continued its focus on de-risking its balance sheet and
decreasing its total assets. Non-interest revenues improved by approximately
$33.5 billion to $31.4 billion in 2009, primarily due to lower negative revenue
marks in 2009. The decrease in net loss from year to year was primarily
attributable to lower revenue marks in 2009 compared with 2008 (a pretax loss
of $3.4 billion in 2009 versus a pretax loss of $38.5 billion in 2008), the $11.1
billion pretax Smith Barney gain on sale recorded in the second quarter of
2009 and a $1.4 billion pretax gain related to the exchange offers recognized
in the third quarter of 2009. Partially offsetting these items were increasing
credit loss provisions during the year and a $10.1 billion pretax loss associated
with the repayment of TARP and the exit from the loss-sharing agreement
with the U.S. government. Additionally, 2008 included a $9.6 billion pretax
goodwill impairment, a $0.9 billion pretax impairment related to Nikko
Asset Management, and $3.3 billion pretax of restructuring/repositioning
charges. Continued strength of the core Citi franchise was demonstrated by
strong revenues in Securities and Banking (S&B) (up 23% from 2008 levels,
excluding credit value adjustments (CVA)) and continued stability in both the
retail and institutional deposit bases. At December 31, 2009, total deposits were
$836 billion, up 8% from December 31, 2008.
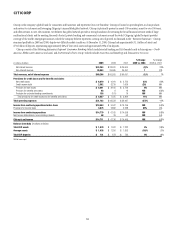
Despite very difficult market and economic conditions, Citicorp remained
profitable with $14.8 billion in income from continuing operations in
2009 versus $6.2 billion in 2008, reflecting the strength of the underlying
franchise, continued client focus, cost management and strengthened risk
management. Citi Holdings recorded a loss of $8.2 billion in 2009 versus
a $36.0 billion loss in 2008 as substantial reductions in negative revenue
marks, cost cuts and the Smith Barney gain more than offset continued
increases in credit costs within Local Consumer Lending. The gain related
to the exchange offers and loss associated with TARP repayment and exiting
the loss-sharing agreement was recorded in Corporate/Other.
Citigroup’s 2009 financial results include the impact of 18 divestitures
completed in 2009, including Smith Barney, Nikko Cordial Securities and
Nikko Asset Management, and 19 divestitures completed in 2008, including
Citi’s German retail banking operations, CitiCapital and Redecard. These
divestitures were completed in accordance with Citi’s strategy of exiting non-
core businesses, while optimizing value for shareholders.
Citi’s effective tax rate on continuing operations in 2009 was 86%, versus
39% in 2008. The tax provision reflected a benefit arising from a higher
proportion of income earned and indefinitely reinvested in countries with
relatively lower tax rates, which accounted for 26 percentage points of
the differential between the federal statutory tax rate and Citi’s effective
tax rate in 2009, as well as a higher proportion of income from tax-
advantaged sources.
Repayment of TARP and Exit from Loss-Sharing
Agreement; Common and Preferred Stock
Activities
Background
In October and December 2008, Citigroup raised $25 billion and $20 billion,
respectively, through the sale of preferred stock and warrants to purchase
common stock to the U.S. Treasury as part of TARP. In January 2009, Citi
issued approximately $7.1 billion of preferred stock to the U.S. Treasury and
FDIC, as well as a warrant to purchase common stock to the U.S. Treasury,
as consideration for the loss-sharing agreement with the U.S. Treasury,
FDIC and the Federal Reserve Bank of New York covering a specified pool of
Citigroup assets.
Pursuant to Citigroup’s exchange offers consummated in July 2009, the
$25 billion of TARP preferred stock issued to the U.S. Treasury in October 2008
was exchanged for approximately 7.7 billion shares of Citigroup common
stock. At the same time, the $20 billion of TARP preferred stock issued to
the U.S. Treasury in December 2008 and the approximately $7.1 billion of