Citibank 2009 Annual Report Download - page 130
Download and view the complete annual report
Please find page 130 of the 2009 Citibank annual report below. You can navigate through the pages in the report by either clicking on the pages listed below, or by using the keyword search tool below to find specific information within the annual report.-
 1
1 -
2
-
3
-
4
-
5
-
6
-
7
-
8
-
9
-
10
-
11
-
12
-
13
-
14
-
15
-
16
-
17
-
18
-
19
-
20
-
21
-
22
-
23
-
24
-
25
-
26
-
27
-
28
-
29
-
30
-
31
-
32
-
33
-
34
-
35
-
36
-
37
-
38
-
39
-
40
-
41
-
42
-
43
-
44
-
45
-
46
-
47
-
48
-
49
-
50
-
51
-
52
-
53
-
54
-
55
-
56
-
57
-
58
-
59
-
60
-
61
-
62
-
63
-
64
-
65
-
66
-
67
-
68
-
69
-
70
-
71
-
72
-
73
-
74
-
75
-
76
-
77
-
78
-
79
-
80
-
81
-
82
-
83
-
84
-
85
-
86
-
87
-
88
-
89
-
90
-
91
-
92
-
93
-
94
-
95
-
96
-
97
-
98
-
99
-
100
-
101
-
102
-
103
-
104
-
105
-
106
-
107
-
108
-
109
-
110
-
111
-
112
-
113
-
114
-
115
-
116
-
117
-
118
-
119
-
 120
120 -
 121
121 -
 122
122 -
 123
123 -
 124
124 -
 125
125 -
 126
126 -
 127
127 -
 128
128 -
 129
129 -
 130
130 -
 131
131 -
 132
132 -
 133
133 -
 134
134 -
 135
135 -
 136
136 -
 137
137 -
 138
138 -
 139
139 -
 140
140 -
141
-
142
-
143
-
144
-
145
-
146
-
147
-
148
-
149
-
150
-
151
-
152
-
153
-
154
-
155
-
156
-
157
-
158
-
159
-
160
-
161
-
162
-
163
-
164
-
165
-
166
-
167
-
168
-
169
-
170
-
171
-
172
-
173
-
174
-
175
-
176
-
177
-
178
-
179
-
180
-
181
-
182
-
183
-
184
-
185
-
186
-
187
-
188
-
189
-
190
-
191
-
192
-
193
-
194
-
195
-
196
-
197
-
198
-
199
-
200
-
201
-
202
-
203
-
204
-
205
-
206
-
207
-
208
-
209
-
210
-
211
-
212
-
213
-
214
-
215
-
216
-
217
-
218
-
219
-
220
-
221
-
222
-
223
-
224
-
225
-
226
-
227
-
228
-
229
-
230
-
231
-
232
-
233
-
234
-
235
-
236
-
237
-
238
-
239
-
240
-
241
-
242
-
243
-
244
-
245
-
246
-
247
-
248
-
249
-
250
-
251
-
252
-
253
-
254
-
255
-
256
-
257
-
258
-
259
-
260
-
261
-
262
-
263
-
264
-
265
-
266
-
267
-
268
-
269
-
270
-
271
-
272
-
273
-
274
-
275
-
276
-
277
-
278
-
279
-
280
-
281
-
282
-
283
-
284
 |
 |

120
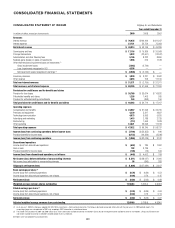
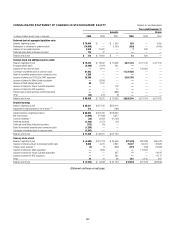
CONSOLIDATED FINANCIAL STATEMENTS
CONSOLIDATED STATEMENT OF INCOME Citigroup Inc. and Subsidiaries
Year ended December 31
In millions of dollars, except per-share amounts 2009 2008 2007
Revenues
Interest revenue $ 76,635 $106,499 $121,347
Interest expense 27,721 52,750 75,958
Net interest revenue $ 48,914 $ 53,749 $ 45,389
Commissions and fees $ 17,116 $ 10,366 $ 20,068
Principal transactions 3,932 (22,601) (12,347)
Administration and other fiduciary fees 5,195 8,222 8,860
Realized gains (losses) on sales of investments 1,996 679 1,168
Other than temporary impairment losses on investments (1)
Gross impairment losses (7,262) (2,740) —
Less: Impairments recognized in OCI 4,356 — —
Net impairment losses recognized in earnings (1) $ (2,906) $ (2,740) $ —
Insurance premiums $ 3,020 $ 3,221 $ 3,062
Other revenue 3,018 703 11,100
Total non-interest revenues $ 31,371 $ (2,150) $ 31,911
Total revenues, net of interest expense $ 80,285 $ 51,599 $ 77,300
Provisions for credit losses and for benefits and claims
Provision for loan losses $ 38,760 $ 33,674 $ 16,832
Policyholder benefits and claims 1,258 1,403 935
Provision for unfunded lending commitments 244 (363) 150
Total provisions for credit losses and for benefits and claims $ 40,262 $ 34,714 $ 17,917
Operating expenses
Compensation and benefits $ 24,987 $ 31,096 $ 32,705
Premises and equipment 4,339 5,317 4,837
Technology/communication 4,573 5,993 5,620
Advertising and marketing 1,415 2,188 2,729
Restructuring (113) 1,550 1,528
Other operating 12,621 23,096 11,318
Total operating expenses $ 47,822 $ 69,240 $ 58,737
Income (loss) from continuing operations before income taxes $ (7,799) $ (52,355) $ 646
Provision (benefit) for income taxes (6,733) (20,326) (2,546)
Income (loss) from continuing operations $ (1,066) $ (32,029) $ 3,192
Discontinued operations
Income (loss) from discontinued operations $ (653) $ 784 $ 1,052
Gain on sale 102 3,139 —
Provision (benefit) for income taxes (106) (79) 344
Income (loss) from discontinued operations, net of taxes $ (445) $ 4,002 $ 708
Net income (loss) before attribution of noncontrolling interests $ (1,511) $ (28,027) $ 3,900
Net income (loss) attributable to noncontrolling interests 95 (343) 283
Citigroup’s net income (loss) $ (1,606) $ (27,684) $ 3,617
Basic earnings per share (2)
Income (loss) from continuing operations $ (0.76) $ (6.39) $ 0.53
Income (loss) from discontinued operations, net of taxes (0.04) 0.76 0.15
Net income (loss) $ (0.80) $ (5.63) $ 0.68
Weighted average common shares outstanding 11,568.3 5,265.4 4,905.8
Diluted earnings per share (2)
Income (loss) from continuing operations $ (0.76) $ (6.39) $ 0.53
Income (loss) from discontinued operations, net of taxes (0.04) 0.76 0.14
Net income (loss) $ (0.80) $ (5.63) $ 0.67
Adjusted weighted average common shares outstanding 12,099.0 5,768.9 4,924.0
(1) As of January 1, 2009, the Company adopted ASC 320-10-65, Investments—Debt and Equity Securities. The Company disclosed comparable information with the prior year in its 2009 periodic reports. This
accounting change was not applicable to 2007 and, accordingly, 2007 information is not disclosed above.
(2) The Diluted EPS calculation for 2009 and 2008 utilizes Basic shares and Income available to common shareholders (Basic) due to the negative Income available to common shareholders. Using actual Diluted shares
and Income available to common shareholders (Diluted) would result in anti-dilution.
See Notes to the Consolidated Financial Statements.