Citibank 2009 Annual Report Download - page 80
Download and view the complete annual report
Please find page 80 of the 2009 Citibank annual report below. You can navigate through the pages in the report by either clicking on the pages listed below, or by using the keyword search tool below to find specific information within the annual report.-
 1
1 -
2
-
3
-
4
-
5
-
6
-
7
-
8
-
9
-
10
-
11
-
12
-
13
-
14
-
15
-
16
-
17
-
18
-
19
-
20
-
21
-
22
-
23
-
24
-
25
-
26
-
27
-
28
-
29
-
30
-
31
-
32
-
33
-
34
-
35
-
36
-
37
-
38
-
39
-
40
-
41
-
42
-
43
-
44
-
45
-
46
-
47
-
48
-
49
-
50
-
51
-
52
-
53
-
54
-
55
-
56
-
57
-
58
-
59
-
60
-
61
-
62
-
63
-
64
-
65
-
66
-
67
-
68
-
69
-
 70
70 -
 71
71 -
 72
72 -
 73
73 -
 74
74 -
 75
75 -
 76
76 -
 77
77 -
 78
78 -
 79
79 -
 80
80 -
 81
81 -
 82
82 -
 83
83 -
 84
84 -
 85
85 -
 86
86 -
 87
87 -
 88
88 -
 89
89 -
 90
90 -
91
-
92
-
93
-
94
-
95
-
96
-
97
-
98
-
99
-
100
-
101
-
102
-
103
-
104
-
105
-
106
-
107
-
108
-
109
-
110
-
111
-
112
-
113
-
114
-
115
-
116
-
117
-
118
-
119
-
120
-
121
-
122
-
123
-
124
-
125
-
126
-
127
-
128
-
129
-
130
-
131
-
132
-
133
-
134
-
135
-
136
-
137
-
138
-
139
-
140
-
141
-
142
-
143
-
144
-
145
-
146
-
147
-
148
-
149
-
150
-
151
-
152
-
153
-
154
-
155
-
156
-
157
-
158
-
159
-
160
-
161
-
162
-
163
-
164
-
165
-
166
-
167
-
168
-
169
-
170
-
171
-
172
-
173
-
174
-
175
-
176
-
177
-
178
-
179
-
180
-
181
-
182
-
183
-
184
-
185
-
186
-
187
-
188
-
189
-
190
-
191
-
192
-
193
-
194
-
195
-
196
-
197
-
198
-
199
-
200
-
201
-
202
-
203
-
204
-
205
-
206
-
207
-
208
-
209
-
210
-
211
-
212
-
213
-
214
-
215
-
216
-
217
-
218
-
219
-
220
-
221
-
222
-
223
-
224
-
225
-
226
-
227
-
228
-
229
-
230
-
231
-
232
-
233
-
234
-
235
-
236
-
237
-
238
-
239
-
240
-
241
-
242
-
243
-
244
-
245
-
246
-
247
-
248
-
249
-
250
-
251
-
252
-
253
-
254
-
255
-
256
-
257
-
258
-
259
-
260
-
261
-
262
-
263
-
264
-
265
-
266
-
267
-
268
-
269
-
270
-
271
-
272
-
273
-
274
-
275
-
276
-
277
-
278
-
279
-
280
-
281
-
282
-
283
-
284
 |
 |

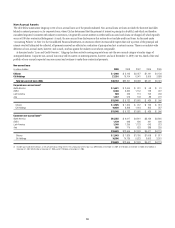
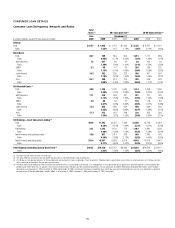
70
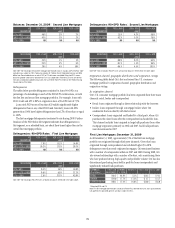
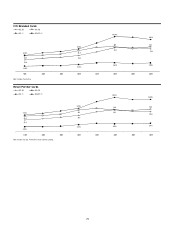
Consumer Loan Delinquency Amounts and Ratios
Total
loans (1) 90+ days past due (2) 30-89 days past due (2)
Dec. December 31,
In millions of dollars, except EOP loan amounts in billions 2009 2009 2008 2007 2009 2008 2007
Citicorp
Total $124.7 $ 1,935 $ 1,710 $1,545 $ 2,325 $ 2,567 $ 2,151
Ratio 1.55% 1.41 1.19% 1.86% 2.11% 1.65%
Retail Bank
Total 80.7 789 584 500 1,011 1,111 856
Ratio 0.98% 0.77% 0.62% 1.25% 1.46% 1.07%
North America 7.2 107 84 31 82 100 34
Ratio 1.49% 1.29% 1.41% 1.14% 1.54% 1.55%
EMEA 5.2 60 47 30 203 194 122
Ratio 1.15% 0.75% 0.45% 3.90% 3.08% 1.82%
Latin America 18.2 382 239 229 300 261 297
Ratio 2.10% 1.52% 1.44% 1.65% 1.66% 1.87%
Asia 50.1 240 214 210 426 556 403
Ratio 0.48% 0.45% 0.38% 0.85% 1.17% 0.73%
Citi-Branded Cards (3)
Total 44.0 1,146 1,126 1,045 1,314 1,456 1,295
Ratio 2.60% 2.47% 2.09% 2.98% 3.20% 2.59%
North America 11.1 238 263 221 251 277 242
Ratio 2.14% 1.84% 1.33% 2.26% 1.94% 1.46%
EMEA 3.0 80 36 21 135 118 87
Ratio 2.67% 1.28% 0.84% 4.50% 4.21% 3.48%
Latin America 12.2 555 566 554 558 636 606
Ratio 4.55% 4.80% 3.85% 4.57% 5.39% 4.21%
Asia 17.7 273 261 249 370 425 360
Ratio 1.54% 1.57% 1.50% 2.09% 2.56% 2.17%
Citi Holdings—Local Consumer Lending (4)
Total 293.4 17,793 12,027 7,439 12,258 13,743 10,961
Ratio 6.26% 3.51% 1.99% 4.31% 4.01% 2.93%
International 33.1 1,345 1,152 773 1,467 1,830 1,539
Ratio 4.06% 2.68% 1.56% 4.43% 4.26% 3.10%
North America retail partners cards (3) 18.9 851 1,017 656 948 1,343 975
Ratio 4.50% 3.38% 2.19% 5.02% 4.46% 3.26%
North America (excluding cards) 241.4 15,597 9,858 6,010 9,843 10,570 8,447
Ratio 6.71% 3.65% 2.02% 4.24% 3.91% 2.84%
Total Citigroup (excluding Special Asset Pool) (4) $418.1 $19,728 $13,737 $8,984 $14,583 $16,310 $13,112
Ratio 4.82% 2.96% 1.78% 3.56% 3.51% 2.60%
(1) Total loans exclude interest and fees on credit cards.
(2) The ratios of 90 days or more past due and 30-89 days past due are calculated based on end-of-period loans.
(3) The 90 days or more past due balances for Citi-branded cards and retail partners cards are generally still accruing interest. Citigroup’s policy is generally to accrue interest on credit card loans until 180 days past due,
unless notification of bankruptcy filing has been received earlier.
(4) The 90 or more and 30-89 days past due and related ratio for North America LCL (excluding cards) excludes U.S. mortgage loans that are guaranteed by U.S. government-sponsored agencies since the potential loss
predominantly resides within the U.S. agencies. The amounts excluded for loans 90+days past due and (end-of-period loans) for each period are: $5.4 billion ($9.0 billion), $3.0 billion ($6.2 billion), and $1.8 billion
($3.3 billion) as of December 31, 2009, December 31, 2008 and December 31, 2007, respectively. The amounts excluded for loans 30-89 days past due (end-of-period loans have the same adjustment as above) for
each period are: $1.0 billion, $0.6 billion, and $0.4 billion, as of December 31, 2009, December 31, 2008, and December 31, 2007, respectively.
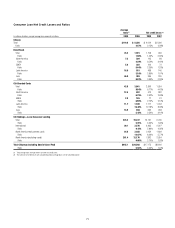
CONSUMER LOAN DETAILS