Citibank 2009 Annual Report Download - page 85
Download and view the complete annual report
Please find page 85 of the 2009 Citibank annual report below. You can navigate through the pages in the report by either clicking on the pages listed below, or by using the keyword search tool below to find specific information within the annual report.-
 1
1 -
2
-
3
-
4
-
5
-
6
-
7
-
8
-
9
-
10
-
11
-
12
-
13
-
14
-
15
-
16
-
17
-
18
-
19
-
20
-
21
-
22
-
23
-
24
-
25
-
26
-
27
-
28
-
29
-
30
-
31
-
32
-
33
-
34
-
35
-
36
-
37
-
38
-
39
-
40
-
41
-
42
-
43
-
44
-
45
-
46
-
47
-
48
-
49
-
50
-
51
-
52
-
53
-
54
-
55
-
56
-
57
-
58
-
59
-
60
-
61
-
62
-
63
-
64
-
65
-
66
-
67
-
68
-
69
-
70
-
71
-
72
-
73
-
74
-
 75
75 -
 76
76 -
 77
77 -
 78
78 -
 79
79 -
 80
80 -
 81
81 -
 82
82 -
 83
83 -
 84
84 -
 85
85 -
 86
86 -
 87
87 -
 88
88 -
 89
89 -
 90
90 -
 91
91 -
 92
92 -
 93
93 -
 94
94 -
 95
95 -
96
-
97
-
98
-
99
-
100
-
101
-
102
-
103
-
104
-
105
-
106
-
107
-
108
-
109
-
110
-
111
-
112
-
113
-
114
-
115
-
116
-
117
-
118
-
119
-
120
-
121
-
122
-
123
-
124
-
125
-
126
-
127
-
128
-
129
-
130
-
131
-
132
-
133
-
134
-
135
-
136
-
137
-
138
-
139
-
140
-
141
-
142
-
143
-
144
-
145
-
146
-
147
-
148
-
149
-
150
-
151
-
152
-
153
-
154
-
155
-
156
-
157
-
158
-
159
-
160
-
161
-
162
-
163
-
164
-
165
-
166
-
167
-
168
-
169
-
170
-
171
-
172
-
173
-
174
-
175
-
176
-
177
-
178
-
179
-
180
-
181
-
182
-
183
-
184
-
185
-
186
-
187
-
188
-
189
-
190
-
191
-
192
-
193
-
194
-
195
-
196
-
197
-
198
-
199
-
200
-
201
-
202
-
203
-
204
-
205
-
206
-
207
-
208
-
209
-
210
-
211
-
212
-
213
-
214
-
215
-
216
-
217
-
218
-
219
-
220
-
221
-
222
-
223
-
224
-
225
-
226
-
227
-
228
-
229
-
230
-
231
-
232
-
233
-
234
-
235
-
236
-
237
-
238
-
239
-
240
-
241
-
242
-
243
-
244
-
245
-
246
-
247
-
248
-
249
-
250
-
251
-
252
-
253
-
254
-
255
-
256
-
257
-
258
-
259
-
260
-
261
-
262
-
263
-
264
-
265
-
266
-
267
-
268
-
269
-
270
-
271
-
272
-
273
-
274
-
275
-
276
-
277
-
278
-
279
-
280
-
281
-
282
-
283
-
284
 |
 |

75
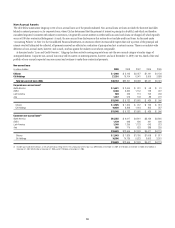
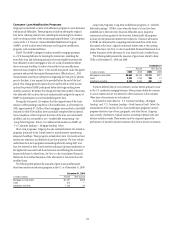
Data appearing in the tables below have been sourced from Citigroup’s
risk systems and, as such, may not reconcile with disclosures elsewhere
generally due to differences in methodology or variations in the manner in
which information is captured. Citi has noted such variations in instances
where it believes they could be material to reconcile the information
presented elsewhere.
Citi’s credit risk policy is not to offer option ARMs/negative amortizing
mortgage products to its customers. As a result, option ARMs/negative
amortizing mortgages represent an insignificant portion of total balances
that were acquired only incidentally as part of prior portfolio and
business purchases.
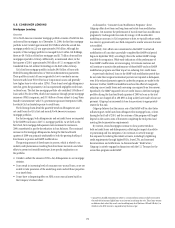
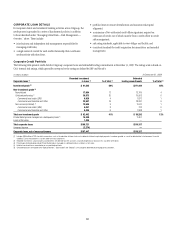
A portion of loans in the U.S. mortgage portfolio currently requires a
payment to satisfy only the current accrued interest for the payment period,
or an interest-only payment. Our mortgage portfolio includes approximately
$28 billion of first and second lien home equity lines of credit (HELOCs) that
are still within their revolving period and have not commenced amortization.
The interest-only payment feature during the revolving period is standard for
the HELOC product across the industry. The first mortgage portfolio contains
approximately $33 billion of mostly adjustable rate mortgages (ARMs) that
are currently required to make an interest-only payment. These loans will
be required to make a fully amortizing payment upon expiration of their
interest-only payment period, and most will do so within a few years of
origination. Borrowers that are currently required to make an interest-only
payment cannot select a lower payment that would negatively amortize the
loan. First mortgage loans with this payment feature are primarily to high-
credit-quality borrowers that have on average significantly higher refreshed
FICO scores than other loans in the first mortgage portfolio.
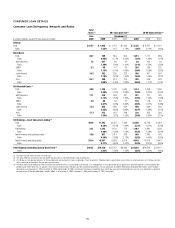
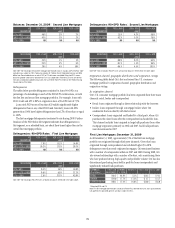
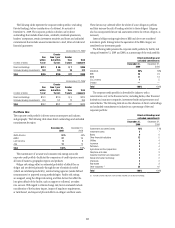
Loan balances
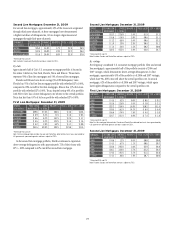
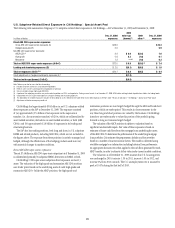
First mortgages—Loan balances. As a consequence of the difficult
economic environment and the decrease in housing prices, LTV and FICO
scores have deteriorated since origination as depicted in the table below. On
a refreshed basis, approximately 28% of first lien mortgages had a LTV ratio
above 100%, compared to approximately 0% at origination. Approximately
30% of the first lien mortgages had FICO scores less than 620 on a refreshed
basis, compared to 15% at origination. One half of the first lien mortgages
with refreshed LTV ratios above 100% have refreshed FICO scores greater than
660; 90 + DPD rates for this portion of the portfolio were 2.8%.
Balances: December 31, 2009—First Lien Mortgages
AT
ORIGINATION
FICO≥660 620<FICO<660 FICO<620
LTV ≤ 80% 59% 6% 7%
80% < LTV ≤ 100% 13% 7% 8%
LTV > 100% NM NM NM
REFRESHED FICO≥660 620≤FICO
<660
FICO<620
LTV ≤ 80% 30% 4% 10%
80% < LTV ≤ 100% 16% 3% 9%
LTV > 100% 14% 3% 11%
Note: NM – Not meaningful. First lien mortgage table excludes loans in Canada and Puerto Rico. Table
excludes loans guaranteed by U.S. government sponsored agencies and loans subject to LTSCs. Table
also excludes $2.0 billion from At Origination balances and $1.0 billion from Refreshed balances for which
FICO or LTV data were unavailable. Balances exclude deferred fees/costs. Refreshed FICO scores based on
updated credit scores obtained from Fair Isaac Corporation. Refreshed LTV ratios are derived from data at
origination updated using mainly the Case-Shiller Home Price Index or the Federal Housing Finance Agency
Price Index.
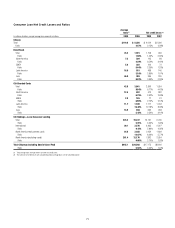
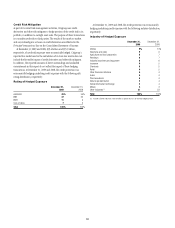
Second mortgages—Loan balances. In the second lien mortgage
portfolio, the majority of loans are in the higher FICO categories. The
challenging economic conditions have caused a migration towards lower
FICO scores and higher LTV ratios. Approximately 42% of that portfolio had
refreshed loan-to-value ratios above 100%, compared to approximately 0%
at origination. Approximately 18% of second lien mortgages had FICO scores
less than 620 on a refreshed basis, compared to 4% at origination. Over
two thirds of the second lien loans with LTV ratios greater than 100% had
refreshed FICO scores greater than 660; 90+ DPD rates for this portion of the
portfolio were 0.4%.