Citibank 2009 Annual Report Download - page 32
Download and view the complete annual report
Please find page 32 of the 2009 Citibank annual report below. You can navigate through the pages in the report by either clicking on the pages listed below, or by using the keyword search tool below to find specific information within the annual report.-
 1
1 -
2
-
3
-
4
-
5
-
6
-
7
-
8
-
9
-
10
-
11
-
12
-
13
-
14
-
15
-
16
-
17
-
18
-
19
-
20
-
21
-
 22
22 -
 23
23 -
 24
24 -
 25
25 -
 26
26 -
 27
27 -
 28
28 -
 29
29 -
 30
30 -
 31
31 -
 32
32 -
 33
33 -
 34
34 -
 35
35 -
 36
36 -
 37
37 -
 38
38 -
 39
39 -
 40
40 -
 41
41 -
 42
42 -
43
-
44
-
45
-
46
-
47
-
48
-
49
-
50
-
51
-
52
-
53
-
54
-
55
-
56
-
57
-
58
-
59
-
60
-
61
-
62
-
63
-
64
-
65
-
66
-
67
-
68
-
69
-
70
-
71
-
72
-
73
-
74
-
75
-
76
-
77
-
78
-
79
-
80
-
81
-
82
-
83
-
84
-
85
-
86
-
87
-
88
-
89
-
90
-
91
-
92
-
93
-
94
-
95
-
96
-
97
-
98
-
99
-
100
-
101
-
102
-
103
-
104
-
105
-
106
-
107
-
108
-
109
-
110
-
111
-
112
-
113
-
114
-
115
-
116
-
117
-
118
-
119
-
120
-
121
-
122
-
123
-
124
-
125
-
126
-
127
-
128
-
129
-
130
-
131
-
132
-
133
-
134
-
135
-
136
-
137
-
138
-
139
-
140
-
141
-
142
-
143
-
144
-
145
-
146
-
147
-
148
-
149
-
150
-
151
-
152
-
153
-
154
-
155
-
156
-
157
-
158
-
159
-
160
-
161
-
162
-
163
-
164
-
165
-
166
-
167
-
168
-
169
-
170
-
171
-
172
-
173
-
174
-
175
-
176
-
177
-
178
-
179
-
180
-
181
-
182
-
183
-
184
-
185
-
186
-
187
-
188
-
189
-
190
-
191
-
192
-
193
-
194
-
195
-
196
-
197
-
198
-
199
-
200
-
201
-
202
-
203
-
204
-
205
-
206
-
207
-
208
-
209
-
210
-
211
-
212
-
213
-
214
-
215
-
216
-
217
-
218
-
219
-
220
-
221
-
222
-
223
-
224
-
225
-
226
-
227
-
228
-
229
-
230
-
231
-
232
-
233
-
234
-
235
-
236
-
237
-
238
-
239
-
240
-
241
-
242
-
243
-
244
-
245
-
246
-
247
-
248
-
249
-
250
-
251
-
252
-
253
-
254
-
255
-
256
-
257
-
258
-
259
-
260
-
261
-
262
-
263
-
264
-
265
-
266
-
267
-
268
-
269
-
270
-
271
-
272
-
273
-
274
-
275
-
276
-
277
-
278
-
279
-
280
-
281
-
282
-
283
-
284
 |
 |

22
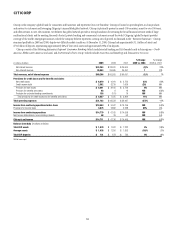
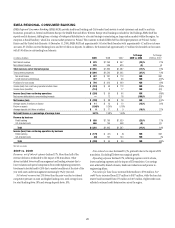
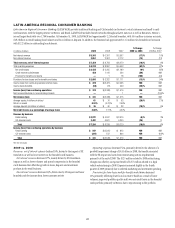
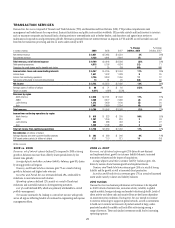
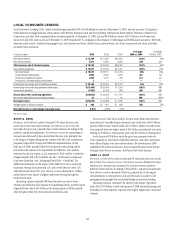
LATIN AMERICA REGIONAL CONSUMER BANKING
Latin America Regional Consumer Banking (LATAM RCB) provides traditional banking and Citi-branded card services to retail customers and small to mid-
size businesses, with the largest presence in Mexico and Brazil. LATAM RCB includes branch networks throughout Latin America as well as Banamex, Mexico’s
second largest bank with over 1,700 branches. At December 31, 2009, LATAM RCB had approximately 2,216 retail branches, with 16.6 million customer accounts,
$18.2 billion in retail banking loan balances and $41.4 billion in deposits. In addition, the business had approximately 12.2 million Citi-branded card accounts
with $12.2 billion in outstanding loan balances.
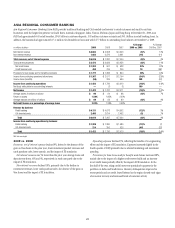
In millions of dollars 2009 2008 2007
% Change
2009 vs. 2008
% Change
2008 vs. 2007
Net interest revenue $5,303 $ 6,391 $ 5,567 (17)% 15%
Non-interest revenue 2,051 2,367 2,712 (13) (13)
Total revenues, net of interest expense $7,354 $ 8,758 $ 8,279 (16)% 6%
Total operating expenses $4,232 $ 8,857 $ 4,503 (52)% 97%
Net credit losses $2,435 $ 2,205 $ 1,189 10% 85%
Credit reserve build/(release) 458 1,116 504 (59) NM
Provision for benefits and claims —1 18 (100) (94)
Provisions for loan losses and for benefits and claims $2,893 $ 3,322 $ 1,711 (13)% 94%
Income (loss) from continuing operations before taxes $ 229 $(3,421) $ 2,065 NM NM
Income taxes (benefits) (94) (73) 449 (29)% NM
Income (loss) from continuing operations $ 323 $(3,348) $ 1,616 NM NM
Net income attributable to noncontrolling interests —— 1 —(100)%
Net income (loss) $ 323 $(3,348) $ 1,615 NM NM
Average assets (in billions of dollars) 61 $ 76 $ 63 (20)% 21%
Return on assets 0.53% (4.41)% 2.56%
Average deposits (in billions of dollars) $ 36 $ 40 $ 38 (10)% 5%
Net credit losses as a percentage of average loans 8.60% 7.11% 4.57%
Revenue by business
Retail banking $3,872 $ 4,097 $ 3,979 (5)% 3%
Citi-branded cards 3,482 4,661 4,300 (25) 8
Total $ 7,354 $ 8,758 $ 8,279 (16)% 6%
Income (loss) from continuing operations by business
Retail banking $ 547 $(3,500) $ 812 NM NM
Citi-branded cards (224) 152 804 NM (81)%
Total $ 323 $(3,348) $ 1,616 NM NM
NM Not meaningful
2009 vs. 2008
Revenues, net of interest expense declined 16%, driven by the impact of FX
translation as well as lower activity in the branded cards business.
Net interest revenue decreased 17%, mainly driven by FX translation
impact as well as lower volumes and spread compression in the branded
cards business that offset the growth in loans, deposits and investment
products in the retail business.
Non interest revenue decreased 13%, driven also by FX impact and lower
branded cards fee income from lower customer activity.
Operating expenses decreased 52%, primarily driven by the absence of a
goodwill impairment charge of $4.3 billion in 2008, the benefit associated
with the FX impact and saves from restructuring actions implemented
primarily at the end of 2008. The $125 million related to 2008 restructuring
charges was offset by an expense benefit of $257 million related to a legal
vehicle restructuring in 2008. Expenses increased slightly in the fourth
quarter of 2009 primarily due to selected marketing and investment spending.
Provisions for loan losses and for benefits and claims decreased
13% primarily reflecting lower loan loss reserve builds as a result of lower
volumes, improved portfolio quality and lower net credit losses in the branded
cards portfolio primarily in Mexico due to repositioning in the portfolio.