Citibank 2009 Annual Report Download - page 19
Download and view the complete annual report
Please find page 19 of the 2009 Citibank annual report below. You can navigate through the pages in the report by either clicking on the pages listed below, or by using the keyword search tool below to find specific information within the annual report.-
 1
1 -
2
-
3
-
4
-
5
-
6
-
7
-
8
-
 9
9 -
 10
10 -
 11
11 -
 12
12 -
 13
13 -
 14
14 -
 15
15 -
 16
16 -
 17
17 -
 18
18 -
 19
19 -
 20
20 -
 21
21 -
 22
22 -
 23
23 -
 24
24 -
 25
25 -
 26
26 -
 27
27 -
 28
28 -
 29
29 -
30
-
31
-
32
-
33
-
34
-
35
-
36
-
37
-
38
-
39
-
40
-
41
-
42
-
43
-
44
-
45
-
46
-
47
-
48
-
49
-
50
-
51
-
52
-
53
-
54
-
55
-
56
-
57
-
58
-
59
-
60
-
61
-
62
-
63
-
64
-
65
-
66
-
67
-
68
-
69
-
70
-
71
-
72
-
73
-
74
-
75
-
76
-
77
-
78
-
79
-
80
-
81
-
82
-
83
-
84
-
85
-
86
-
87
-
88
-
89
-
90
-
91
-
92
-
93
-
94
-
95
-
96
-
97
-
98
-
99
-
100
-
101
-
102
-
103
-
104
-
105
-
106
-
107
-
108
-
109
-
110
-
111
-
112
-
113
-
114
-
115
-
116
-
117
-
118
-
119
-
120
-
121
-
122
-
123
-
124
-
125
-
126
-
127
-
128
-
129
-
130
-
131
-
132
-
133
-
134
-
135
-
136
-
137
-
138
-
139
-
140
-
141
-
142
-
143
-
144
-
145
-
146
-
147
-
148
-
149
-
150
-
151
-
152
-
153
-
154
-
155
-
156
-
157
-
158
-
159
-
160
-
161
-
162
-
163
-
164
-
165
-
166
-
167
-
168
-
169
-
170
-
171
-
172
-
173
-
174
-
175
-
176
-
177
-
178
-
179
-
180
-
181
-
182
-
183
-
184
-
185
-
186
-
187
-
188
-
189
-
190
-
191
-
192
-
193
-
194
-
195
-
196
-
197
-
198
-
199
-
200
-
201
-
202
-
203
-
204
-
205
-
206
-
207
-
208
-
209
-
210
-
211
-
212
-
213
-
214
-
215
-
216
-
217
-
218
-
219
-
220
-
221
-
222
-
223
-
224
-
225
-
226
-
227
-
228
-
229
-
230
-
231
-
232
-
233
-
234
-
235
-
236
-
237
-
238
-
239
-
240
-
241
-
242
-
243
-
244
-
245
-
246
-
247
-
248
-
249
-
250
-
251
-
252
-
253
-
254
-
255
-
256
-
257
-
258
-
259
-
260
-
261
-
262
-
263
-
264
-
265
-
266
-
267
-
268
-
269
-
270
-
271
-
272
-
273
-
274
-
275
-
276
-
277
-
278
-
279
-
280
-
281
-
282
-
283
-
284
 |
 |

9
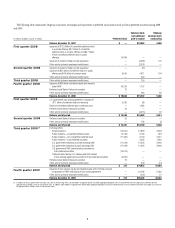
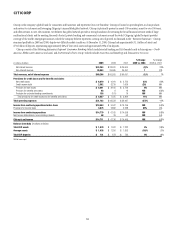
The following table summarizes Citigroup’s issuances, exchanges and repayments of preferred and common stock and trust preferred securities during 2008
and 2009:
In millions of dollars, shares in millions Preferred stock
Common stock
and additional
paid-in capital
Citigroup
common stock
outstanding
Balance, December 31, 2007 $ — $18,062 4,995
First quarter 2008 Issuance of $12.5 billion of convertible preferred stock
in a private offering, $3.2 billion of convertible
preferred stock in a public offering, and $3.7 billion
of non-convertible preferred stock in public
offerings 19,384 — —
Issuance of shares for Nikko Cordial acquisition — (3,485) 175
Other activity (primarily employee benefit plans) — (3,391) —
Second quarter 2008 Issuance of shares for Nikko Cordial acquisition — (15) —
Issuance of $8.0 billion of preferred stock in a public
offering and $4.9 billion of common stock 8,040 4,911 194
Other activity (primarily employee benefit plans) — 569 —
Third quarter 2008 Other activity (primarily employee benefit plans) — 290 —
Fourth quarter 2008 Issuance of $45 billion of preferred stock and warrants
under TARP 43,203 1,797 —
Preferred stock Series H discount accretion 37 — —
Other activity (primarily employee benefit plans) — 484 86
Balance, December 31, 2008 $ 70,664 $19,222 5,450
First quarter 2009 U.S. government loss-sharing agreement; issuance of
$7.1 billion of preferred stock and warrants 3,530 88 —
Reset of convertible preferred stock conversion price — 1,285 —
Preferred stock Series H discount accretion 52 — —
Other activity (primarily employee benefit plans) — (4,013) 63
Balance, end of period $ 74,246 $16,582 5,513
Second quarter 2009 Preferred stock Series H discount accretion 55 — —
Other activity (primarily employee benefit plans) — 138 (5)
Balance, end of period $ 74,301 $16,720 5,508
Third quarter 2009 (1) Exchange offers:
Private investors (12,500) 21,839 3,846
Public investors—convertible preferred stock (3,146) 5,136 823
Public investors—non-convertible preferred stock (11,465) 9,149 3,351
Public investors—trust preferred securities — 4,532 1,660
U.S. government matching of private exchange offer (11,924) 10,653 3,846
U.S. government matching of public exchange offer (11,926) 10,654 3,846
U.S. government TARP preferred stock converted to
trust preferred securities (19,514) — —
Preferred stock held by U.S. Treasury and FDIC related
to loss-sharing agreement (converted to trust preferred securities) (3,530) — —
Preferred stock Series H discount accretion 16 — —
Other activity (primarily employee benefit plans) — 349 (16)
Balance, end of period $ 312 $79,032 22,864
Fourth quarter 2009 Issuance of new common equity and tangible equity units (T-DECs) pursuant
to repayment of TARP and exiting of loss-sharing agreement — 20,298 5,582
Other activity (primarily employee benefit plans) — (902) 37
Balance, December 31, 2009 $ 312 $98,428 28,483
(1) In addition to the U.S. government exchanges, pursuant to the exchange offers, private holders of approximately $12.5 billion aggregate liquidation value of Citi preferred stock exchanged such preferred stock for
approximately 3.8 billion shares of Citi common stock. In addition, public holders of approximately $20.3 billion aggregate liquidation value of Citi preferred stock and trust preferred securities exchanged such securities
for approximately 5.8 billion shares of Citi common stock.