Citibank 2009 Annual Report Download - page 90
Download and view the complete annual report
Please find page 90 of the 2009 Citibank annual report below. You can navigate through the pages in the report by either clicking on the pages listed below, or by using the keyword search tool below to find specific information within the annual report.-
 1
1 -
2
-
3
-
4
-
5
-
6
-
7
-
8
-
9
-
10
-
11
-
12
-
13
-
14
-
15
-
16
-
17
-
18
-
19
-
20
-
21
-
22
-
23
-
24
-
25
-
26
-
27
-
28
-
29
-
30
-
31
-
32
-
33
-
34
-
35
-
36
-
37
-
38
-
39
-
40
-
41
-
42
-
43
-
44
-
45
-
46
-
47
-
48
-
49
-
50
-
51
-
52
-
53
-
54
-
55
-
56
-
57
-
58
-
59
-
60
-
61
-
62
-
63
-
64
-
65
-
66
-
67
-
68
-
69
-
70
-
71
-
72
-
73
-
74
-
75
-
76
-
77
-
78
-
79
-
 80
80 -
 81
81 -
 82
82 -
 83
83 -
 84
84 -
 85
85 -
 86
86 -
 87
87 -
 88
88 -
 89
89 -
 90
90 -
 91
91 -
 92
92 -
 93
93 -
 94
94 -
 95
95 -
 96
96 -
 97
97 -
 98
98 -
 99
99 -
 100
100 -
101
-
102
-
103
-
104
-
105
-
106
-
107
-
108
-
109
-
110
-
111
-
112
-
113
-
114
-
115
-
116
-
117
-
118
-
119
-
120
-
121
-
122
-
123
-
124
-
125
-
126
-
127
-
128
-
129
-
130
-
131
-
132
-
133
-
134
-
135
-
136
-
137
-
138
-
139
-
140
-
141
-
142
-
143
-
144
-
145
-
146
-
147
-
148
-
149
-
150
-
151
-
152
-
153
-
154
-
155
-
156
-
157
-
158
-
159
-
160
-
161
-
162
-
163
-
164
-
165
-
166
-
167
-
168
-
169
-
170
-
171
-
172
-
173
-
174
-
175
-
176
-
177
-
178
-
179
-
180
-
181
-
182
-
183
-
184
-
185
-
186
-
187
-
188
-
189
-
190
-
191
-
192
-
193
-
194
-
195
-
196
-
197
-
198
-
199
-
200
-
201
-
202
-
203
-
204
-
205
-
206
-
207
-
208
-
209
-
210
-
211
-
212
-
213
-
214
-
215
-
216
-
217
-
218
-
219
-
220
-
221
-
222
-
223
-
224
-
225
-
226
-
227
-
228
-
229
-
230
-
231
-
232
-
233
-
234
-
235
-
236
-
237
-
238
-
239
-
240
-
241
-
242
-
243
-
244
-
245
-
246
-
247
-
248
-
249
-
250
-
251
-
252
-
253
-
254
-
255
-
256
-
257
-
258
-
259
-
260
-
261
-
262
-
263
-
264
-
265
-
266
-
267
-
268
-
269
-
270
-
271
-
272
-
273
-
274
-
275
-
276
-
277
-
278
-
279
-
280
-
281
-
282
-
283
-
284
 |
 |

80
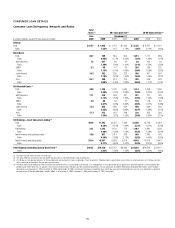
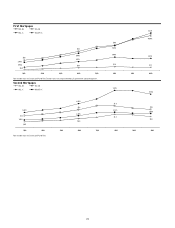
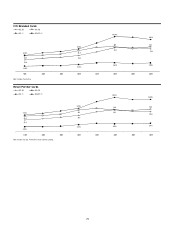
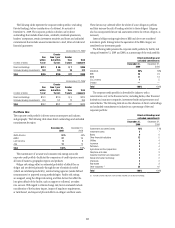
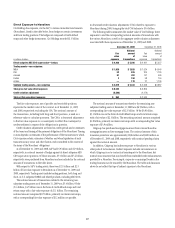
As set forth in the table below, approximately 73% of the Citi-branded
portfolio had FICO credit scores of at least 660 on a refreshed basis as of
December 31, 2009, while 63% of the retail partner cards portfolio had scores
above 660.
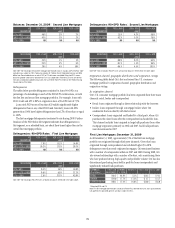
Balances: December 31, 2009
Refreshed Citi Branded Retail Partner
FICO ≥ 660 73% 63%
620 ≤ FICO < 660 11% 13%
FICO < 620 16% 24%
Note: Based on balances of $137 billion. Balances include interest and fees. Excludes Canada, Puerto
Rico, Installment and Classified portfolios. Excludes balances where FICO was unavailable ($0.7 billion for
Citi-branded, $2.1 billion for retail partners cards).
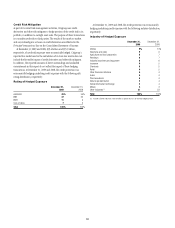
The table below provides delinquency statistics for loans 90+DPD for
both the Citi-branded and retail partners cards portfolios as of December 31,
2009. Given the economic environment, customers have migrated down from
higher FICO score ranges, driven by their delinquencies with Citi and/or with
other creditors. As these customers roll through the delinquency buckets, they
materially damage their credit score and may ultimately go to charge-off.
Loans 90+DPD are more likely to be associated with low refreshed FICO
scores, both because low scores are indicative of repayment risk and because
their delinquency has been reported by Citigroup to the credit bureaus. Loans
with FICO scores less than 620, which constitute 16% of the Citi-branded
portfolio, have a 90+DPD rate of 16.9%; in the retail partner card portfolio,
loans with FICO scores less than 620 constitute 24% of the portfolio and have
a 90+DPD rate of 18.0%.
90+DPD Delinquency Rate: December 31, 2009
Refreshed Citi Branded 90+DPD% Retail Partner 90+DPD%
FICO ≥ 660 0.1% 0.2%
620 ≤ FICO < 660 0.4% 0.7%
FICO < 620 16.9% 18.0%
Note: Based on balances of $137 billion. Balances include interest and fees. Excludes Canada, Puerto Rico,
Installment and Classified portfolios.
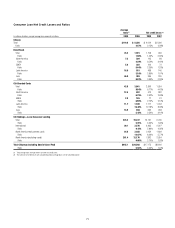
U.S. Installment and Other Revolving Loans
In the table below, Citi’s U.S. Installment portfolio consists of consumer
loans in the following businesses: Consumer Finance, Retail Banking, Auto,
Student Lending and Cards. Other Revolving consists of consumer loans
(Ready Credit and Checking Plus products) in the Consumer Retail Banking
business. Commercial-related loans are not included.
As of December 31, 2009, the U.S. Installment portfolio totaled
approximately $56 billion, while the U.S. Other Revolving portfolio was
approximately $1 billion. While substantially all of the U.S. Installment
portfolio is managed under LCL within Citi Holdings, it does include
$0.4 billion of Consumer Retail Banking loans which are reported in
Citicorp. The U.S. Other Revolving portfolio is managed under Citicorp.
The U.S. Installment portfolio includes $20 billion of Student Loans
originated under the Federal Family Education Loan Program (FFELP)
where losses are substantially mitigated by federal guarantees. These loans
generally have higher 90+DPD rates compared to other installment loans,
but due to the federal guarantees, have lower net credit loss rates relative to
other installment loans.
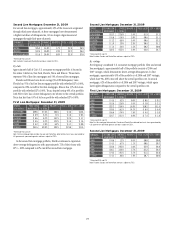
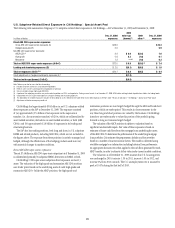
Approximately 43% of the Installment portfolio had FICO credit scores
less than 620 on a refreshed basis. Approximately 30% of the Other Revolving
portfolio is composed of loans having FICO less than 620.
Balances: December 31, 2009
Refreshed Installment Other Revolving
FICO ≥ 660 42% 55%
620 ≤ FICO < 660 15% 15%
FICO < 620 43% 30%
Note: Based on balances of $54 billion for Installment and $0.9 billion for Other Revolving. Excludes
Canada and Puerto Rico. Excludes balances where FICO was unavailable ($2.3 billion for Installment,
$0.1 billion for Other Revolving).
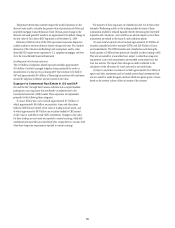
The table below provides delinquency statistics for loans 90+DPD for both
the Installment and Other Revolving portfolios. Loans 90+DPD are more
likely to be associated with low refreshed FICO scores both because low scores
are indicative of repayment risk and because their delinquency has been
reported by Citigroup to the credit bureaus. On a refreshed basis, loans with
FICO scores of less than 620 exhibit significantly higher delinquencies than
in any other FICO band and will drive the majority of the losses.
90+DPD Delinquency Rate: December 31, 2009
Refreshed Installment 90+DPD% Other Revolving 90+DPD%
FICO ≥ 660 0.2% 0.0%
620 ≤ FICO < 660 0.7% 0.3%
FICO < 620 6.1% 8.3%
Note: Based on balances of $54 billion for Installment and $0.9 billion for Other Revolving. Excludes
Canada and Puerto Rico.
s