Citibank 2009 Annual Report Download - page 30
Download and view the complete annual report
Please find page 30 of the 2009 Citibank annual report below. You can navigate through the pages in the report by either clicking on the pages listed below, or by using the keyword search tool below to find specific information within the annual report.-
 1
1 -
2
-
3
-
4
-
5
-
6
-
7
-
8
-
9
-
10
-
11
-
12
-
13
-
14
-
15
-
16
-
17
-
18
-
19
-
 20
20 -
 21
21 -
 22
22 -
 23
23 -
 24
24 -
 25
25 -
 26
26 -
 27
27 -
 28
28 -
 29
29 -
 30
30 -
 31
31 -
 32
32 -
 33
33 -
 34
34 -
 35
35 -
 36
36 -
 37
37 -
 38
38 -
 39
39 -
 40
40 -
41
-
42
-
43
-
44
-
45
-
46
-
47
-
48
-
49
-
50
-
51
-
52
-
53
-
54
-
55
-
56
-
57
-
58
-
59
-
60
-
61
-
62
-
63
-
64
-
65
-
66
-
67
-
68
-
69
-
70
-
71
-
72
-
73
-
74
-
75
-
76
-
77
-
78
-
79
-
80
-
81
-
82
-
83
-
84
-
85
-
86
-
87
-
88
-
89
-
90
-
91
-
92
-
93
-
94
-
95
-
96
-
97
-
98
-
99
-
100
-
101
-
102
-
103
-
104
-
105
-
106
-
107
-
108
-
109
-
110
-
111
-
112
-
113
-
114
-
115
-
116
-
117
-
118
-
119
-
120
-
121
-
122
-
123
-
124
-
125
-
126
-
127
-
128
-
129
-
130
-
131
-
132
-
133
-
134
-
135
-
136
-
137
-
138
-
139
-
140
-
141
-
142
-
143
-
144
-
145
-
146
-
147
-
148
-
149
-
150
-
151
-
152
-
153
-
154
-
155
-
156
-
157
-
158
-
159
-
160
-
161
-
162
-
163
-
164
-
165
-
166
-
167
-
168
-
169
-
170
-
171
-
172
-
173
-
174
-
175
-
176
-
177
-
178
-
179
-
180
-
181
-
182
-
183
-
184
-
185
-
186
-
187
-
188
-
189
-
190
-
191
-
192
-
193
-
194
-
195
-
196
-
197
-
198
-
199
-
200
-
201
-
202
-
203
-
204
-
205
-
206
-
207
-
208
-
209
-
210
-
211
-
212
-
213
-
214
-
215
-
216
-
217
-
218
-
219
-
220
-
221
-
222
-
223
-
224
-
225
-
226
-
227
-
228
-
229
-
230
-
231
-
232
-
233
-
234
-
235
-
236
-
237
-
238
-
239
-
240
-
241
-
242
-
243
-
244
-
245
-
246
-
247
-
248
-
249
-
250
-
251
-
252
-
253
-
254
-
255
-
256
-
257
-
258
-
259
-
260
-
261
-
262
-
263
-
264
-
265
-
266
-
267
-
268
-
269
-
270
-
271
-
272
-
273
-
274
-
275
-
276
-
277
-
278
-
279
-
280
-
281
-
282
-
283
-
284
 |
 |

20
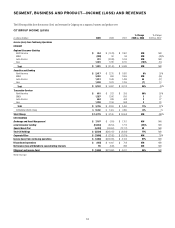
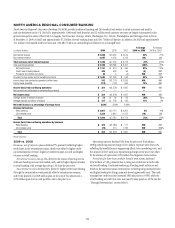
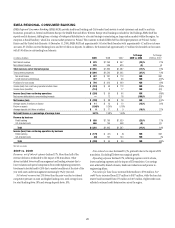
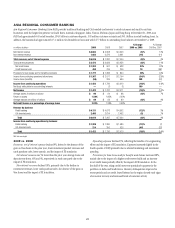
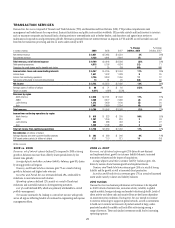
EMEA REGIONAL CONSUMER BANKING
EMEA Regional Consumer Banking (EMEA RCB) provides traditional banking and Citi-branded card services to retail customers and small to mid-size
businesses, primarily in Central and Eastern Europe, the Middle East and Africa. Western Europe retail banking is included in Citi Holdings. EMEA RCB has
repositioned its business, shifting from a strategy of widespread distribution to a focused strategy concentrating on larger urban markets within the region. An
exception is Bank Handlowy, which has a mass market presence in Poland. The countries in which EMEA RCB has the largest presence are Poland, Turkey,
Russia and the United Arab Emirates. At December 31, 2009, EMEA RCB had approximately 341 retail bank branches with approximately 4.2 million customer
accounts, $5.2 billion in retail banking loans and $10.1 billion in deposits. In addition, the business had approximately 2.7 million Citi-branded card accounts
with $3.0 billion in outstanding loan balances.
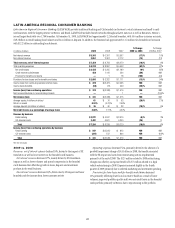
In millions of dollars 2009 2008 2007
% Change
2009 vs. 2008
% Change
2008 vs. 2007
Net interest revenue $ 979 $ 1,269 $ 967 (23)% 31%
Non-interest revenue 576 596 620 (3) (4)
Total revenues, net of interest expense $ 1,555 $ 1,865 $1,587 (17)% 18%
Total operating expenses $1,094 $ 1,500 $1,265 (27)% 19%
Net credit losses $ 487 $ 237 $ 113 NM NM
Credit reserve build/(release) 307 75 96 NM (22)%
Provisions for loan losses $ 794 $ 312 $ 209 NM 49%
Income (loss) from continuing operations before taxes $ (333) $ 53 $ 113 NM (53)%
Income taxes (benefits) (124) 3 17 NM (82)
Income (loss) from continuing operations $ (209) $ 50 $ 96 NM (48)%
Net income attributable to noncontrolling interests —12 18 (100)% (33)
Net income (loss) $ (209) $ 38 $ 78 NM (51)%
Average assets (in billions of dollars) $ 11 $ 13 $ 10 (15)% 30%
Return on assets (1.90)% 0.29% 0.78%
Average deposits (in billions of dollars) $ 9 $ 11 $ 9 (18)% 22%
Net credit losses as a percentage of average loans 5.81% 2.48% 1.56%
Revenue by business
Retail banking $ 889 $ 1,160 $1,039 (23)% 12%
Citi-branded cards 666 705 548 (6) 29
Total $1,555 $ 1,865 $1,587 (17)% 18%
Income (loss) from continuing operations by business
Retail banking $ (179) $ (57) $ (8) NM NM
Citi-branded cards (30) 107 104 NM 3%
Total $ (209) $ 50 $ 96 NM (48)%
NM Not meaningful
2009 vs. 2008
Revenues, net of interest expense declined 17%. More than half of the
revenue decline is attributable to the impact of FX translation. Other
drivers included lower wealth-management and lending revenues due to
lower volumes and spread compression from credit tightening initiatives.
Investment sales declined by 26% due to market conditions at the start of the
year with assets under management increasing by 9% by year end.
Net interest revenue was 23% lower than the prior year due to external
competitive pressure on rates and higher funding costs, with average loans
for retail banking down 18% and average deposits down 18%.
Non-interest revenue decreased by 3%, primarily due to the impact of FX
translation. Excluding FX there was marginal growth.
Operating expenses declined 27%, reflecting expense control actions,
lower marketing expenses and the impact of FX translation. Cost savings
were achieved by branch closures, headcount reductions and process re-
engineering efforts.
Provisions for loan losses increased $482 million to $794 million. Net
credit losses increased from $237 million to $487 million, while the loan loss
reserve build increased from $75 million to $307 million. Higher credit costs
reflected continued credit deterioration across the region.