Citibank 2009 Annual Report Download - page 242
Download and view the complete annual report
Please find page 242 of the 2009 Citibank annual report below. You can navigate through the pages in the report by either clicking on the pages listed below, or by using the keyword search tool below to find specific information within the annual report.-
 1
1 -
2
-
3
-
4
-
5
-
6
-
7
-
8
-
9
-
10
-
11
-
12
-
13
-
14
-
15
-
16
-
17
-
18
-
19
-
20
-
21
-
22
-
23
-
24
-
25
-
26
-
27
-
28
-
29
-
30
-
31
-
32
-
33
-
34
-
35
-
36
-
37
-
38
-
39
-
40
-
41
-
42
-
43
-
44
-
45
-
46
-
47
-
48
-
49
-
50
-
51
-
52
-
53
-
54
-
55
-
56
-
57
-
58
-
59
-
60
-
61
-
62
-
63
-
64
-
65
-
66
-
67
-
68
-
69
-
70
-
71
-
72
-
73
-
74
-
75
-
76
-
77
-
78
-
79
-
80
-
81
-
82
-
83
-
84
-
85
-
86
-
87
-
88
-
89
-
90
-
91
-
92
-
93
-
94
-
95
-
96
-
97
-
98
-
99
-
100
-
101
-
102
-
103
-
104
-
105
-
106
-
107
-
108
-
109
-
110
-
111
-
112
-
113
-
114
-
115
-
116
-
117
-
118
-
119
-
120
-
121
-
122
-
123
-
124
-
125
-
126
-
127
-
128
-
129
-
130
-
131
-
132
-
133
-
134
-
135
-
136
-
137
-
138
-
139
-
140
-
141
-
142
-
143
-
144
-
145
-
146
-
147
-
148
-
149
-
150
-
151
-
152
-
153
-
154
-
155
-
156
-
157
-
158
-
159
-
160
-
161
-
162
-
163
-
164
-
165
-
166
-
167
-
168
-
169
-
170
-
171
-
172
-
173
-
174
-
175
-
176
-
177
-
178
-
179
-
180
-
181
-
182
-
183
-
184
-
185
-
186
-
187
-
188
-
189
-
190
-
191
-
192
-
193
-
194
-
195
-
196
-
197
-
198
-
199
-
200
-
201
-
202
-
203
-
204
-
205
-
206
-
207
-
208
-
209
-
210
-
211
-
212
-
213
-
214
-
215
-
216
-
217
-
218
-
219
-
220
-
221
-
222
-
223
-
224
-
225
-
226
-
227
-
228
-
229
-
230
-
231
-
 232
232 -
 233
233 -
 234
234 -
 235
235 -
 236
236 -
 237
237 -
 238
238 -
 239
239 -
 240
240 -
 241
241 -
 242
242 -
 243
243 -
 244
244 -
 245
245 -
 246
246 -
 247
247 -
 248
248 -
 249
249 -
 250
250 -
 251
251 -
 252
252 -
253
-
254
-
255
-
256
-
257
-
258
-
259
-
260
-
261
-
262
-
263
-
264
-
265
-
266
-
267
-
268
-
269
-
270
-
271
-
272
-
273
-
274
-
275
-
276
-
277
-
278
-
279
-
280
-
281
-
282
-
283
-
284
 |
 |
232
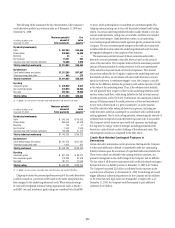
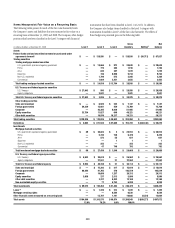
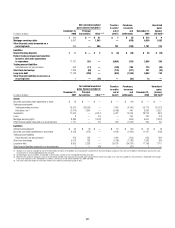
The following is a discussion of the changes to the Level 3 balances for
each of the roll-forward tables presented above.
The significant changes from December 31, 2008 to December 31, 2009 in
Level 3 assets and liabilities are due to:
A net decrease in trading securities of $10.8 billion that was driven by: •
Net transfers of $6.5 billion, due mainly to the transfer of debt –
securities from Level 3 to Level 2 due to increased liquidity and
pricing transparency; and
Net settlements of $5. – 8 billion, due primarily to the liquidations of
subprime securities of $4.1 billion.
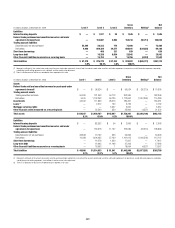
The change in net trading derivatives driven by: •
A net loss of $4. – 9 billion relating to complex derivative contracts,
such as those linked to credit, equity and commodity exposures.
These losses include both realized and unrealized losses during 2009
and are partially offset by gains recognized in instruments that have
been classified in Levels 1 and 2; and
– Net increase in derivative assets of $4.3 billion, which includes cash
settlements of derivative contracts in an unrealized loss position,
notably those linked to subprime exposures.
The decrease in Level 3 Investments of $6.9 billion primarily resulted •
from:
A reduction of $ – 5.0 billion, due mainly to paydowns on debt
securities and sales of private equity investments;
The net transfer of investment securities from Level 3 to Level 2 –
of $1.5 billion, due to increased availability of observable pricing
inputs; and
Net losses recognized of $ – 0.4 billion due mainly to losses on non-
marketable equity securities including write-downs on private equity
investments.
The decrease in securities sold under agreements to repurchase of $9.1 •
billion is driven by a $8.6 billion net transfers from Level 3 to Level 2 as
effective maturity dates on structured repos have shortened.
The decrease in long-term debt of $1.5 billion is driven mainly by • $1.3
billion of net terminations of structured notes.
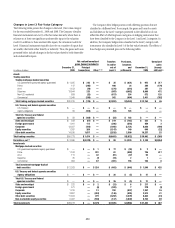
The significant changes from December 31, 2007 to December 31, 2008 in
Level 3 are due to:
A net decrease in trading securities and loans of $24.8 billion that was •
driven by:
Net realized and unrealized losses of $28.1 billion recorded in –
Principal transactions, which was composed mostly of write-downs
recognized on various trading securities including ABCP of $9
billion;
Net transfers in of $7.4 billion, which consisted of approximately –
$26 billion of net transfers in from Level 2 as the availability of
observable pricing inputs continued to decline due to the current
credit crisis, offset by transfers out of Level 3 of approximately
$19 billion primarily related to Level 3 trading inventory being
reclassified to held-to-maturity investments during the fourth quarter
of 2008; and
Net settlements of trading securities of $4.2 billion. –
The shift in the net unrealized gains/(losses) from trading derivatives •
driven by:
A net gain of $7.8 billion relating to complex derivative contracts, –
such as those linked to credit, equity and commodity exposures.
These gains include both realized and unrealized gains and are
partially offset by losses recognized in instruments that have been
classified in Levels 1 and 2; and
$2.2 billion in net transfers in. –
The increase in Investments of $11.2 billion primarily resulted from: •
The addition of $10.3 billion from net purchases, issuances and –
settlements, which included $8.7 billion in senior debt securities
retained by the Company from its sale of a corporate loan portfolio
that included highly leveraged loans during the second quarter of
2008, plus $3 billion of ARS securities purchased from GWM clients,
in accordance with the Auction Rate Securities settlement agreement;
The net transfer in of investment securities from Level 2 of $5.8 –
billion, as the availability of observable pricing inputs continued to
decline due to the current credit crisis; and
Net losses recognized of $4.9 billion which was recorded in –
Accumulated other comprehensive income (loss) primarily related to
Alt-A MBS classified as available-for-sale investments.