Citibank 2009 Annual Report Download - page 20
Download and view the complete annual report
Please find page 20 of the 2009 Citibank annual report below. You can navigate through the pages in the report by either clicking on the pages listed below, or by using the keyword search tool below to find specific information within the annual report.-
 1
1 -
2
-
3
-
4
-
5
-
6
-
7
-
8
-
9
-
 10
10 -
 11
11 -
 12
12 -
 13
13 -
 14
14 -
 15
15 -
 16
16 -
 17
17 -
 18
18 -
 19
19 -
 20
20 -
 21
21 -
 22
22 -
 23
23 -
 24
24 -
 25
25 -
 26
26 -
 27
27 -
 28
28 -
 29
29 -
 30
30 -
31
-
32
-
33
-
34
-
35
-
36
-
37
-
38
-
39
-
40
-
41
-
42
-
43
-
44
-
45
-
46
-
47
-
48
-
49
-
50
-
51
-
52
-
53
-
54
-
55
-
56
-
57
-
58
-
59
-
60
-
61
-
62
-
63
-
64
-
65
-
66
-
67
-
68
-
69
-
70
-
71
-
72
-
73
-
74
-
75
-
76
-
77
-
78
-
79
-
80
-
81
-
82
-
83
-
84
-
85
-
86
-
87
-
88
-
89
-
90
-
91
-
92
-
93
-
94
-
95
-
96
-
97
-
98
-
99
-
100
-
101
-
102
-
103
-
104
-
105
-
106
-
107
-
108
-
109
-
110
-
111
-
112
-
113
-
114
-
115
-
116
-
117
-
118
-
119
-
120
-
121
-
122
-
123
-
124
-
125
-
126
-
127
-
128
-
129
-
130
-
131
-
132
-
133
-
134
-
135
-
136
-
137
-
138
-
139
-
140
-
141
-
142
-
143
-
144
-
145
-
146
-
147
-
148
-
149
-
150
-
151
-
152
-
153
-
154
-
155
-
156
-
157
-
158
-
159
-
160
-
161
-
162
-
163
-
164
-
165
-
166
-
167
-
168
-
169
-
170
-
171
-
172
-
173
-
174
-
175
-
176
-
177
-
178
-
179
-
180
-
181
-
182
-
183
-
184
-
185
-
186
-
187
-
188
-
189
-
190
-
191
-
192
-
193
-
194
-
195
-
196
-
197
-
198
-
199
-
200
-
201
-
202
-
203
-
204
-
205
-
206
-
207
-
208
-
209
-
210
-
211
-
212
-
213
-
214
-
215
-
216
-
217
-
218
-
219
-
220
-
221
-
222
-
223
-
224
-
225
-
226
-
227
-
228
-
229
-
230
-
231
-
232
-
233
-
234
-
235
-
236
-
237
-
238
-
239
-
240
-
241
-
242
-
243
-
244
-
245
-
246
-
247
-
248
-
249
-
250
-
251
-
252
-
253
-
254
-
255
-
256
-
257
-
258
-
259
-
260
-
261
-
262
-
263
-
264
-
265
-
266
-
267
-
268
-
269
-
270
-
271
-
272
-
273
-
274
-
275
-
276
-
277
-
278
-
279
-
280
-
281
-
282
-
283
-
284
 |
 |
10
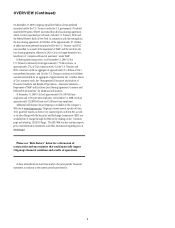
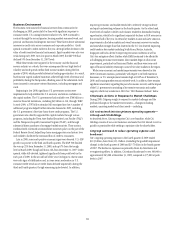
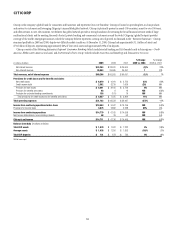
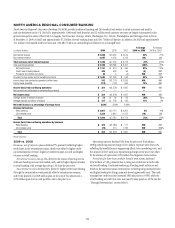
Business Environment
The business environment for financial services firms continued to be
challenging in 2009, particularly for firms with significant exposure to
consumer credit. U.S. unemployment reached 10.1%, GDP continued to
contract through the second quarter, housing markets remained weak, and
personal and business bankruptcies increased. These factors drove substantial
increases in credit costs across consumer and corporate portfolios. Credit
spreads continued to widen earlier in the year, driving further declines in the
value of credit-sensitive financial instruments. Equity markets were also very
weak during early 2009. At its low point in March 2009, the S&P 500 had
declined 55% from December 31, 2007 levels.
While these trends were negative for the economy and the financial
services industry as a whole, they were accompanied by very high levels of
volatility and wide spreads within fixed income markets during the first
quarter of 2009, which provided substantial trading opportunities. As a result,
fixed income capital markets businesses achieved high levels of revenue and
profitability during the first quarter, offsetting some of the substantial credit
losses incurred in consumer-oriented businesses, including mortgages and
cards.
Beginning in late 2008, significant U.S. government actions were
implemented to help stabilize the U.S. economy and restore confidence in
the capital markets. The U.S. government had available over $700 billion to
invest in financial institutions, including $45 billion in Citi, through TARP.
In early 2009, a $787 billion stimulus bill was signed into law. A number of
additional programs helped further stimulate demand in 2009, including
the U.S. government’s first-time home buyer credit programs. The U.S.
government also directly supported the capital markets through various
programs, including the Term Asset-Backed Securities Loan Facility (TALF)
and the Temporary Liquidity Guarantee Program (TLGP), and through
substantial direct purchases of mortgage-backed securities. These actions,
combined with continued accommodative monetary policy on the part of the
Federal Reserve Board, helped keep home mortgage rates near historic lows
and worked to facilitate the continued flow of credit to consumers.
Late in 2009, some early positive economic signs were observed. U.S. GDP
growth was positive in the third and fourth quarters. The S&P 500 finished
the year up 23% from December 31, 2008, and up 67% from the trough
level in March 2009, though still down 24% from December 31, 2007. Credit
spreads, while still elevated, tightened significantly from peak levels in the
early part of 2009. In the second half of the year, Citi began to observe some
very early signs of stabilization and, in some areas, moderation in U.S.
consumer credit trends as net credit losses declined sequentially during the
third and fourth quarters, though remaining quite elevated. In addition,
improving economic and market trends led to relatively stronger advisory
and equity underwriting volumes in the fourth quarter. On the other hand,
lower levels of market volatility and volumes resulted in diminished trading
opportunities, which led to significant sequential declines in S&B revenues in
the second half of the year. In certain key markets in Asia and Latin America,
improvement in the labor markets and overall economic recovery was earlier,
and somewhat stronger, than that observed in the U.S. Citi observed improving
credit trends in key markets including South Korea, Mexico, Australia,
Singapore and India, driven by improving economic conditions as well as
Citi’s loss mitigation efforts. Further, while EMEA continued to be affected by
a challenging economic environment, labor markets began to show some
improvement, particularly in Russia and Turkey, and there were some early
signs of financial stability returning to some of Citi’s key markets in the region.
While some economic and market improvements were observed in late
2009, Citi remains cautious, particularly with respect to its North American
businesses, as U.S. unemployment remains high at 10.0% as of December 31,
2009, and housing markets remain relatively weak. In addition, there remains
significant uncertainty regarding the pace of economic recovery and the impact
of the U.S. government’s unwinding of its extensive economic and market
supports, which may accelerate in 2010. See “2010 Business Outlook” below.
Citigroup’s Actions in Response to Market Challenges
During 2009, Citigroup sought to respond to market challenges and the
profound changes in the market environment—changes in funding
markets, operating models and client needs—including:
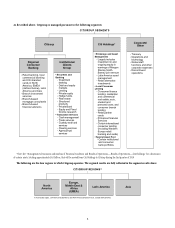
Citi restructured into two primary operating segments—
Citicorp and Citi Holdings.
As described above, Citicorp comprises Citi’s core franchise, while Citi
Holdings consists of non-core businesses and assets that Citi intends to exit as
quickly as practicable while seeking to optimize value for shareholders.
Citigroup continued to reduce operating expenses and
headcount.
Citi’s ongoing operating expenses in the fourth quarter of 2009 totaled
$12.3 billion, down from $15.1 billion (excluding the goodwill impairment
charge) in the fourth quarter of 2008 and $15.7 billion in the fourth quarter
of 2007. The decline in expenses was primarily driven by divestitures and
re-engineering efforts. In addition, Citi reduced headcount by over 100,000 to
approximately 265,000 at December 31, 2009, compared to 375,000 at peak
levels in 2007.