Citibank 2009 Annual Report Download - page 21
Download and view the complete annual report
Please find page 21 of the 2009 Citibank annual report below. You can navigate through the pages in the report by either clicking on the pages listed below, or by using the keyword search tool below to find specific information within the annual report.-
 1
1 -
2
-
3
-
4
-
5
-
6
-
7
-
8
-
9
-
10
-
 11
11 -
 12
12 -
 13
13 -
 14
14 -
 15
15 -
 16
16 -
 17
17 -
 18
18 -
 19
19 -
 20
20 -
 21
21 -
 22
22 -
 23
23 -
 24
24 -
 25
25 -
 26
26 -
 27
27 -
 28
28 -
 29
29 -
 30
30 -
 31
31 -
32
-
33
-
34
-
35
-
36
-
37
-
38
-
39
-
40
-
41
-
42
-
43
-
44
-
45
-
46
-
47
-
48
-
49
-
50
-
51
-
52
-
53
-
54
-
55
-
56
-
57
-
58
-
59
-
60
-
61
-
62
-
63
-
64
-
65
-
66
-
67
-
68
-
69
-
70
-
71
-
72
-
73
-
74
-
75
-
76
-
77
-
78
-
79
-
80
-
81
-
82
-
83
-
84
-
85
-
86
-
87
-
88
-
89
-
90
-
91
-
92
-
93
-
94
-
95
-
96
-
97
-
98
-
99
-
100
-
101
-
102
-
103
-
104
-
105
-
106
-
107
-
108
-
109
-
110
-
111
-
112
-
113
-
114
-
115
-
116
-
117
-
118
-
119
-
120
-
121
-
122
-
123
-
124
-
125
-
126
-
127
-
128
-
129
-
130
-
131
-
132
-
133
-
134
-
135
-
136
-
137
-
138
-
139
-
140
-
141
-
142
-
143
-
144
-
145
-
146
-
147
-
148
-
149
-
150
-
151
-
152
-
153
-
154
-
155
-
156
-
157
-
158
-
159
-
160
-
161
-
162
-
163
-
164
-
165
-
166
-
167
-
168
-
169
-
170
-
171
-
172
-
173
-
174
-
175
-
176
-
177
-
178
-
179
-
180
-
181
-
182
-
183
-
184
-
185
-
186
-
187
-
188
-
189
-
190
-
191
-
192
-
193
-
194
-
195
-
196
-
197
-
198
-
199
-
200
-
201
-
202
-
203
-
204
-
205
-
206
-
207
-
208
-
209
-
210
-
211
-
212
-
213
-
214
-
215
-
216
-
217
-
218
-
219
-
220
-
221
-
222
-
223
-
224
-
225
-
226
-
227
-
228
-
229
-
230
-
231
-
232
-
233
-
234
-
235
-
236
-
237
-
238
-
239
-
240
-
241
-
242
-
243
-
244
-
245
-
246
-
247
-
248
-
249
-
250
-
251
-
252
-
253
-
254
-
255
-
256
-
257
-
258
-
259
-
260
-
261
-
262
-
263
-
264
-
265
-
266
-
267
-
268
-
269
-
270
-
271
-
272
-
273
-
274
-
275
-
276
-
277
-
278
-
279
-
280
-
281
-
282
-
283
-
284
 |
 |
11
Citigroup strengthened its balance sheet.
Citi increased its common capital ratios. •
Citi significantly increased its Tier 1 Common and Tangible Common
Equity (TCE) ratios during 2009, primarily as a result of its exchange
offers completed in the third quarter of 2009. At December 31, 2009, Citi’s
Tier 1 Common ratio was 9.6% and its TCE ratio was 10.9%, compared
to 2.3% and 3.1% at December 31, 2008, respectively. In addition, Citi’s
Tier 1 Capital ratio was 11.7% at December 31, 2009. Tier 1 Common and
related ratios are measures used and relied on by U.S. banking regulators;
however, Tier 1 Common, TCE and related ratios are non-GAAP financial
measures for SEC purposes. See “Capital Resources and Liquidity—
Capital Resources” for additional information on these measures.
Citi improved its liquidity position. •
Citigroup lengthened the maturity structure of its liabilities, increased
balances of cash and highly liquid securities, continued to grow its
deposit base, raised substantial equity capital and reduced illiquid assets,
primarily in Citi Holdings. As a result, structural liquidity (defined as
deposits, long-term debt and equity as a percentage of total assets) grew
to 73% as of December 31, 2009, compared to 66% at December 31, 2008
and 63% at December 31, 2007. Citigroup had $193 billion of cash and
deposits with banks as of December 31, 2009. Citi currently anticipates
issuing less than $15 billion of Citigroup-level long-term debt in 2010
(down from $85 billion in 2009) due to its current strong liquidity
position and anticipated asset reductions within Citi Holdings.
Citi continued to de-risk and decrease the amount of its total assets. •
Citi’s total assets were approximately $1.86 trillion as of December 31,
2009, down from approximately $1.94 trillion at December 31, 2008
and $2.19 trillion at December 31, 2007. Consistent with Citi’s strategy,
Citi Holdings now represents less than 30% of Citi’s total assets as of
December 31, 2009, compared to 41% at the start of 2008. While Citi made
progress in de-risking and decreasing total assets, particularly in Citi
Holdings, these actions, together with an expansion of the Company’s loss
mitigation efforts and declining yields in the trading book, resulted in a
9% reduction in net interest revenue in 2009 versus 2008 and a decrease in
Citi’s net interest margin (NIM) to 2.65% at December 31, 2009 compared
to 3.26% at December 31, 2008.
Citigroup increased its allowance for loan losses.
During 2009, Citi added a net build of $8.0 billion to its allowance for loan
losses. The allowance for loan losses was $36 billion at December 31, 2009, or
6.1% of loans, compared to $29.6 billion, or 4.3% of loans, at year-end 2008.
With the adoption of SFAS 166 and 167 in the first quarter of 2010, loan loss
reserves would have been $49.4 billion, or 6.6% of loans, each as of December
31, 2009 and based on current estimates. The consumer loan loss reserve was
$28.4 billion at December 31, 2009, representing 14.1 months of concurrent
charge-off coverage, versus 13.1 months at December 31, 2008.
Citi began to make selected investments in its core
businesses.
Within Regional Consumer Banking, Citi began making selected
investments in its core businesses in the latter part of 2009. For example,
in Asia, Citi invested in new customer acquisition in the emerging affluent
segment and in card usage promotion. In Latin America, Citi invested in
card account acquisition, with a focus on higher-quality new accounts,
consistent with portfolio repositioning objectives. Citigroup also continued to
invest in consumer banking technology, for example, in banking products
in markets such as Singapore, Hong Kong and South Korea, where mobile
phones and mobile banking have intersected in ways not yet seen in the
U.S. Within Transaction Services, Citi continued to invest in technology to
support its global network, including its investor services suite of products,
prepaid and commercial cards offerings and launch of a new front end
online banking technology that provides a diverse set of functionality beyond
traditional transaction management and reporting. These and similar
investments have increased, and will likely continue to increase, Citi’s
operating expenses.
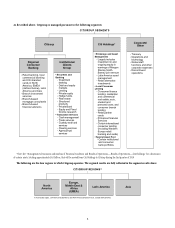
2010 BUSINESS OUTLOOK
While showing signs of improvement, the macroeconomic environment
going into 2010 remains challenging, with U.S. unemployment still elevated.
The U.S. government has indicated its intention to continue scaling back
programs put in place to support the market during 2008 and 2009. The
impact of the U.S. government’s exit from many of these programs is a
source of uncertainty in 2010, as is the future course of monetary policy.
In addition, the potential impact of new laws and regulations (e.g., The
Credit Card Accountability Responsibility and Disclosure Act of 2009 (CARD
Act)), potential new capital standards, and other legislative and regulatory
initiatives is a source of significant additional uncertainty regarding the
business and market environment.