Citibank 2009 Annual Report Download - page 43
Download and view the complete annual report
Please find page 43 of the 2009 Citibank annual report below. You can navigate through the pages in the report by either clicking on the pages listed below, or by using the keyword search tool below to find specific information within the annual report.-
 1
1 -
2
-
3
-
4
-
5
-
6
-
7
-
8
-
9
-
10
-
11
-
12
-
13
-
14
-
15
-
16
-
17
-
18
-
19
-
20
-
21
-
22
-
23
-
24
-
25
-
26
-
27
-
28
-
29
-
30
-
31
-
32
-
 33
33 -
 34
34 -
 35
35 -
 36
36 -
 37
37 -
 38
38 -
 39
39 -
 40
40 -
 41
41 -
 42
42 -
 43
43 -
 44
44 -
 45
45 -
 46
46 -
 47
47 -
 48
48 -
 49
49 -
 50
50 -
 51
51 -
 52
52 -
 53
53 -
54
-
55
-
56
-
57
-
58
-
59
-
60
-
61
-
62
-
63
-
64
-
65
-
66
-
67
-
68
-
69
-
70
-
71
-
72
-
73
-
74
-
75
-
76
-
77
-
78
-
79
-
80
-
81
-
82
-
83
-
84
-
85
-
86
-
87
-
88
-
89
-
90
-
91
-
92
-
93
-
94
-
95
-
96
-
97
-
98
-
99
-
100
-
101
-
102
-
103
-
104
-
105
-
106
-
107
-
108
-
109
-
110
-
111
-
112
-
113
-
114
-
115
-
116
-
117
-
118
-
119
-
120
-
121
-
122
-
123
-
124
-
125
-
126
-
127
-
128
-
129
-
130
-
131
-
132
-
133
-
134
-
135
-
136
-
137
-
138
-
139
-
140
-
141
-
142
-
143
-
144
-
145
-
146
-
147
-
148
-
149
-
150
-
151
-
152
-
153
-
154
-
155
-
156
-
157
-
158
-
159
-
160
-
161
-
162
-
163
-
164
-
165
-
166
-
167
-
168
-
169
-
170
-
171
-
172
-
173
-
174
-
175
-
176
-
177
-
178
-
179
-
180
-
181
-
182
-
183
-
184
-
185
-
186
-
187
-
188
-
189
-
190
-
191
-
192
-
193
-
194
-
195
-
196
-
197
-
198
-
199
-
200
-
201
-
202
-
203
-
204
-
205
-
206
-
207
-
208
-
209
-
210
-
211
-
212
-
213
-
214
-
215
-
216
-
217
-
218
-
219
-
220
-
221
-
222
-
223
-
224
-
225
-
226
-
227
-
228
-
229
-
230
-
231
-
232
-
233
-
234
-
235
-
236
-
237
-
238
-
239
-
240
-
241
-
242
-
243
-
244
-
245
-
246
-
247
-
248
-
249
-
250
-
251
-
252
-
253
-
254
-
255
-
256
-
257
-
258
-
259
-
260
-
261
-
262
-
263
-
264
-
265
-
266
-
267
-
268
-
269
-
270
-
271
-
272
-
273
-
274
-
275
-
276
-
277
-
278
-
279
-
280
-
281
-
282
-
283
-
284
 |
 |

33
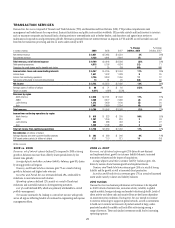
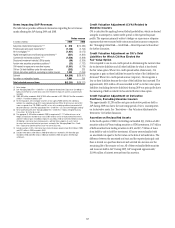
Provisions for loan losses and for benefits and claims increased 76%
versus the prior year reflecting increased net credit losses of $6.4 billion and
higher reserve builds of $3.1 billion. Higher net credit losses were primarily
driven by $3.9 billion in real estate lending and $0.8 billion in retail partner
cards.
Assets decreased $65 billion versus the prior year, primarily driven by Real
Estate Lending and higher loan loss reserve balances in 2008.
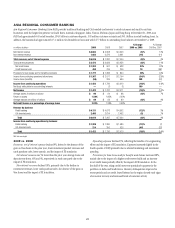
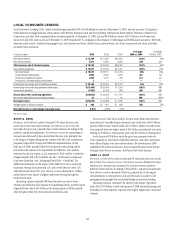
Managed Presentations
The following is a reconciliation of Managed-basis net credit losses in
LCL. For a discussion of Managed-basis presentations, see North America
Regional Consumer Banking.
2009 2008 2007
Managed credit losses as a percentage of average
managed loans 6.60% 4.00% 2.25%
Impact from credit card securitizations 0.69% 0.44% 0.35%
Net credit losses as a percentage of
average loans 5.91% 3.56% 1.90%
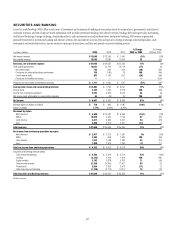
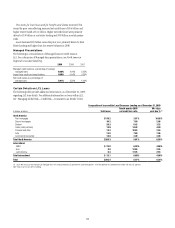
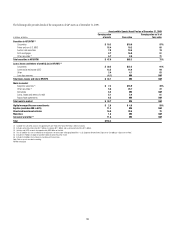
Certain Details on LCL Loans
The following table provides additional information, as of December 31, 2009,
regarding LCL loan details. For additional information on loans within LCL,
see “Managing Global Risk—Credit Risk—Consumer Loan Details” below.
Composition of loans within Local Consumer Lending as of December 31, 2009
In billions of dollars Total loans
Fourth quarter 2009
net credit loss ratio
90+ days
past due % (1)
North America
First mortgages $118.2 3.51% 10.93%
Second mortgages 54.2 7.00 2.96
Student 26.3 0.42 3.33
Cards (retail partners) 18.9 14.43 4.50
Personal and other 18.3 10.83 3.04
Auto 13.8 7.80 1.96
Commercial real estate 10.6 3.49 3.35
Total North America $260.3 5.61% 6.55%
International
EMEA $ 23.0 6.95% 4.86%
Asia 9.8 12.65 2.25
Latin America 0.3 17.25 2.16
Total international $ 33.1 8.69% 4.06%
Total $293.4 5.97% 6.26%
(1) Loans 90+ days past due exclude U.S. mortgage loans that are guaranteed by U.S. government-sponsored agencies, since the potential loss predominantly resides with the U.S. agencies.
Note: Totals may not sum due to rounding.