Citibank 2009 Annual Report Download - page 76
Download and view the complete annual report
Please find page 76 of the 2009 Citibank annual report below. You can navigate through the pages in the report by either clicking on the pages listed below, or by using the keyword search tool below to find specific information within the annual report.-
 1
1 -
2
-
3
-
4
-
5
-
6
-
7
-
8
-
9
-
10
-
11
-
12
-
13
-
14
-
15
-
16
-
17
-
18
-
19
-
20
-
21
-
22
-
23
-
24
-
25
-
26
-
27
-
28
-
29
-
30
-
31
-
32
-
33
-
34
-
35
-
36
-
37
-
38
-
39
-
40
-
41
-
42
-
43
-
44
-
45
-
46
-
47
-
48
-
49
-
50
-
51
-
52
-
53
-
54
-
55
-
56
-
57
-
58
-
59
-
60
-
61
-
62
-
63
-
64
-
65
-
 66
66 -
 67
67 -
 68
68 -
 69
69 -
 70
70 -
 71
71 -
 72
72 -
 73
73 -
 74
74 -
 75
75 -
 76
76 -
 77
77 -
 78
78 -
 79
79 -
 80
80 -
 81
81 -
 82
82 -
 83
83 -
 84
84 -
 85
85 -
 86
86 -
87
-
88
-
89
-
90
-
91
-
92
-
93
-
94
-
95
-
96
-
97
-
98
-
99
-
100
-
101
-
102
-
103
-
104
-
105
-
106
-
107
-
108
-
109
-
110
-
111
-
112
-
113
-
114
-
115
-
116
-
117
-
118
-
119
-
120
-
121
-
122
-
123
-
124
-
125
-
126
-
127
-
128
-
129
-
130
-
131
-
132
-
133
-
134
-
135
-
136
-
137
-
138
-
139
-
140
-
141
-
142
-
143
-
144
-
145
-
146
-
147
-
148
-
149
-
150
-
151
-
152
-
153
-
154
-
155
-
156
-
157
-
158
-
159
-
160
-
161
-
162
-
163
-
164
-
165
-
166
-
167
-
168
-
169
-
170
-
171
-
172
-
173
-
174
-
175
-
176
-
177
-
178
-
179
-
180
-
181
-
182
-
183
-
184
-
185
-
186
-
187
-
188
-
189
-
190
-
191
-
192
-
193
-
194
-
195
-
196
-
197
-
198
-
199
-
200
-
201
-
202
-
203
-
204
-
205
-
206
-
207
-
208
-
209
-
210
-
211
-
212
-
213
-
214
-
215
-
216
-
217
-
218
-
219
-
220
-
221
-
222
-
223
-
224
-
225
-
226
-
227
-
228
-
229
-
230
-
231
-
232
-
233
-
234
-
235
-
236
-
237
-
238
-
239
-
240
-
241
-
242
-
243
-
244
-
245
-
246
-
247
-
248
-
249
-
250
-
251
-
252
-
253
-
254
-
255
-
256
-
257
-
258
-
259
-
260
-
261
-
262
-
263
-
264
-
265
-
266
-
267
-
268
-
269
-
270
-
271
-
272
-
273
-
274
-
275
-
276
-
277
-
278
-
279
-
280
-
281
-
282
-
283
-
284
 |
 |

66
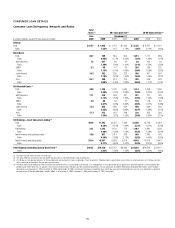
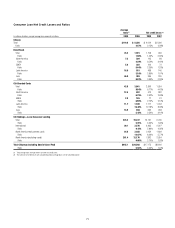
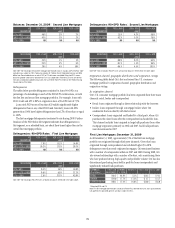
Non-Accrual Assets
The table below summarizes Citigroup’s view of non-accrual loans as of the periods indicated. Non-accrual loans are loans in which the borrower has fallen
behind in interest payments or, for corporate loans, where Citi has determined that the payment of interest or principal is doubtful, and which are therefore
considered impaired. Consistent with industry conventions, Citi generally accrues interest on credit card loans until such loans are charged-off, which typically
occurs at 180 days contractual delinquency. As such, the non-accrual loan disclosures in this section do not include credit card loans. As discussed under
“Accounting Policies” in Note 1 to the Consolidated Financial Statements, in situations where Citi reasonably expects that only a portion of the principal and
interest owed will ultimately be collected, all payments received are reflected as a reduction of principal and not as interest income. There is no industry-wide
definition of non-accrual assets, however, and as such, analysis against the industry is not always comparable.
As discussed under “Loan and Credit Overview,” Citigroup has been actively moving corporate loans into the non-accrual category at earlier stages of
anticipated distress. Corporate non-accrual loans may still be current on interest payments, however, and as of December 31, 2009, over two-thirds of the total
portfolio of non-accrual corporate loans are current and continue to make their contractual payments.
Non-accrual loans
In millions of dollars 2009 2008 2007 2006 2005
Citicorp $ 4,968 $ 3,193 $2,027 $1,141 $1,136
Citi Holdings 27,216 19,104 6,941 3,906 3,888
Total non-accrual loans (NAL) $32,184 $22,297 $8,968 $5,047 $5,024
Corporate non-accrual loans(1)
North America $ 5,621 $ 2,660 $ 291 $ 68 $ 91
EMEA 6,308 6,330 1,152 128 297
Latin America 569 229 119 152 246
Asia 1,047 513 103 88 272
$13,545 $ 9,732 $1,665 $ 436 $ 906
Citicorp $ 2,925 $ 1,364 $ 247 $ 133 $ 319
Citi Holdings 10,620 8,368 1,418 303 587
$13,545 $ 9,732 $1,665 $ 436 $ 906
Consumer non-accrual loans(1)
North America $15,555 $ 9,617 $4,841 $3,139 $2,860
EMEA 1,159 948 696 441 396
Latin America 1,340 1,290 1,133 643 523
Asia 585 710 633 388 339
$18,639 $12,565 $7,303 $4,611 $4,118
Citicorp $ 2,043 $ 1,829 $1,780 $1,008 $ 817
Citi Holdings 16,596 10,736 5,523 3,603 3,301
$18,639 $12,565 $7,303 $4,611 $4,118
(1) Excludes purchased distressed loans as they are generally accreting interest. The carrying value of these loans was $920 million at December 31, 2009, $1.510 billion at December 31, 2008, $2.373 billion at
December 31, 2007, $949 million at December 31, 2006, and $1.120 billion at December 31, 2005.