Citibank 2009 Annual Report Download - page 39
Download and view the complete annual report
Please find page 39 of the 2009 Citibank annual report below. You can navigate through the pages in the report by either clicking on the pages listed below, or by using the keyword search tool below to find specific information within the annual report.-
 1
1 -
2
-
3
-
4
-
5
-
6
-
7
-
8
-
9
-
10
-
11
-
12
-
13
-
14
-
15
-
16
-
17
-
18
-
19
-
20
-
21
-
22
-
23
-
24
-
25
-
26
-
27
-
28
-
 29
29 -
 30
30 -
 31
31 -
 32
32 -
 33
33 -
 34
34 -
 35
35 -
 36
36 -
 37
37 -
 38
38 -
 39
39 -
 40
40 -
 41
41 -
 42
42 -
 43
43 -
 44
44 -
 45
45 -
 46
46 -
 47
47 -
 48
48 -
 49
49 -
50
-
51
-
52
-
53
-
54
-
55
-
56
-
57
-
58
-
59
-
60
-
61
-
62
-
63
-
64
-
65
-
66
-
67
-
68
-
69
-
70
-
71
-
72
-
73
-
74
-
75
-
76
-
77
-
78
-
79
-
80
-
81
-
82
-
83
-
84
-
85
-
86
-
87
-
88
-
89
-
90
-
91
-
92
-
93
-
94
-
95
-
96
-
97
-
98
-
99
-
100
-
101
-
102
-
103
-
104
-
105
-
106
-
107
-
108
-
109
-
110
-
111
-
112
-
113
-
114
-
115
-
116
-
117
-
118
-
119
-
120
-
121
-
122
-
123
-
124
-
125
-
126
-
127
-
128
-
129
-
130
-
131
-
132
-
133
-
134
-
135
-
136
-
137
-
138
-
139
-
140
-
141
-
142
-
143
-
144
-
145
-
146
-
147
-
148
-
149
-
150
-
151
-
152
-
153
-
154
-
155
-
156
-
157
-
158
-
159
-
160
-
161
-
162
-
163
-
164
-
165
-
166
-
167
-
168
-
169
-
170
-
171
-
172
-
173
-
174
-
175
-
176
-
177
-
178
-
179
-
180
-
181
-
182
-
183
-
184
-
185
-
186
-
187
-
188
-
189
-
190
-
191
-
192
-
193
-
194
-
195
-
196
-
197
-
198
-
199
-
200
-
201
-
202
-
203
-
204
-
205
-
206
-
207
-
208
-
209
-
210
-
211
-
212
-
213
-
214
-
215
-
216
-
217
-
218
-
219
-
220
-
221
-
222
-
223
-
224
-
225
-
226
-
227
-
228
-
229
-
230
-
231
-
232
-
233
-
234
-
235
-
236
-
237
-
238
-
239
-
240
-
241
-
242
-
243
-
244
-
245
-
246
-
247
-
248
-
249
-
250
-
251
-
252
-
253
-
254
-
255
-
256
-
257
-
258
-
259
-
260
-
261
-
262
-
263
-
264
-
265
-
266
-
267
-
268
-
269
-
270
-
271
-
272
-
273
-
274
-
275
-
276
-
277
-
278
-
279
-
280
-
281
-
282
-
283
-
284
 |
 |

29
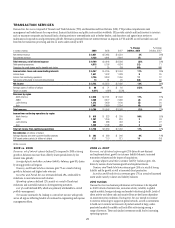
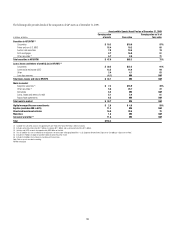
TRANSACTION SERVICES
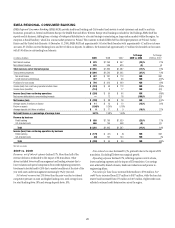
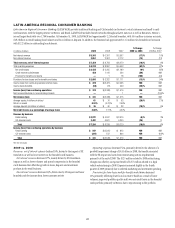
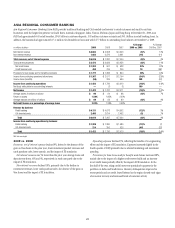
Transaction Services is composed of Treasury and Trade Solutions (TTS) and Securities and Fund Services (SFS). TTS provides comprehensive cash
management and trade finance for corporations, financial institutions and public sector entities worldwide. SFS provides custody and funds services to investors
such as insurance companies and mutual funds, clearing services to intermediaries such as broker-dealers, and depository and agency/trust services to
multinational corporations and governments globally. Revenue is generated from net interest revenue on deposits in TTS and SFS, as well as trade loans and
from fees for transaction processing and fees on assets under custody in SFS.
In millions of dollars 2009 2008 2007
% Change
2009 vs. 2008
% Change
2008 vs. 2007
Net interest revenue $ 5,651 $ 5,485 $ 4,254 3% 29%
Non-interest revenue 4,138 4,461 3,844 (7) 16
Total revenues, net of interest expense $ 9,789 $ 9,946 $ 8,098 (2)% 23%
Total operating expenses 4,515 5,156 4,634 (12) 11
Provisions for credit losses and for benefits and claims 735 (30) (80) NM
Income before taxes and noncontrolling interests $ 5,267 $ 4,755 $ 3,494 11% 36%
Income taxes 1,531 1,402 1,038 935
Income from continuing operations 3,736 3,353 2,456 11 37
Net income attributable to noncontrolling interests 13 31 20 (58) 55
Net income $ 3,723 $ 3,322 $ 2,436 12% 36%
Average assets (in billions of dollars) $ 60 $ 71 $ 69 (15)% 3%
Return on assets 6.21% 4.68% 3.53%
Revenues by region
North America $ 2,526 $ 2,161 $ 1,646 17% 31%
EMEA 3,389 3,677 2,999 (8) 23
Latin America 1,373 1,439 1,199 (5) 20
Asia 2,501 2,669 2,254 (6) 18
Total revenues $ 9,789 $ 9,946 $ 8,098 (2)% 23%
Income from continuing operations by region
North America $ 615 $ 323 $ 209 90% 55%
EMEA 1,287 1,246 816 353
Latin America 604 588 463 327
Asia 1,230 1,196 968 324
Total net income from continuing operations $ 3,736 $ 3,353 $ 2,456 11% 37%
Key indicators (in billions of dollars)
Average deposits and other customer liability balances $ 303 $ 280 $ 246 8% 14%
EOP assets under custody (in trillions of dollars) 12.1 11.0 13.1 10 (16)
NM Not meaningful
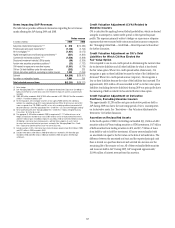
2009 vs. 2008
Revenues, net of interest expense declined 2% compared to 2008 as strong
growth in balances was more than offset by lower spreads driven by low
interest rates globally.
Average deposits and other customer liability balances grew 8%, driven
by strong growth in all regions.
Treasury and Trade Solutions revenues grew 7% as a result of strong
growth in balances and higher trade revenues.
Securities and Funds Services revenues declined 18%, attributable to
reductions in asset valuations and volumes.
Operating expenses declined 12%, mainly as a result of headcount
reductions and successful execution of reengineering initiatives.
Cost of credit declined 80%, which was primarily attributable to overall
portfolio management.
Net income increased 12%, leading to a record net income, with growth
across all regions reflecting benefits of continued re-engineering and expense
management efforts.
2008 vs. 2007
Revenues, net of interest expense grew 23% driven by new business
and implementations, growth in customer liability balances, increased
transaction volumes and the impact of acquisitions.
Average deposits and other customer liability balances grew 14%
driven by success of new business growth and implementations.
Treasury and Trade Solutions revenues grew 26% as a result of strong
liability and fee growth as well as increased client penetration.
Securities and Funds Services revenues grew 17% as a result of increased
assets under custody, volumes and liability balances.
2010 Outlook
Transaction Services business performance will continue to be impacted
in 2010 by levels of interest rates, economic activity, volatility in global
capital markets, foreign exchange and market valuations globally. Levels of
client activity and client cash and security flows are key factors dependent
on macroeconomic conditions. Transaction Services intends to continue
to invest in technology to support its global network, as well as investments
to build out its investor services suite of products aimed at large, under-
penetrated markets for middle and back office outsourcing among a
range of investors. These and similar investments could lead to increasing
operating expenses.