Citibank 2009 Annual Report Download - page 187
Download and view the complete annual report
Please find page 187 of the 2009 Citibank annual report below. You can navigate through the pages in the report by either clicking on the pages listed below, or by using the keyword search tool below to find specific information within the annual report.-
 1
1 -
2
-
3
-
4
-
5
-
6
-
7
-
8
-
9
-
10
-
11
-
12
-
13
-
14
-
15
-
16
-
17
-
18
-
19
-
20
-
21
-
22
-
23
-
24
-
25
-
26
-
27
-
28
-
29
-
30
-
31
-
32
-
33
-
34
-
35
-
36
-
37
-
38
-
39
-
40
-
41
-
42
-
43
-
44
-
45
-
46
-
47
-
48
-
49
-
50
-
51
-
52
-
53
-
54
-
55
-
56
-
57
-
58
-
59
-
60
-
61
-
62
-
63
-
64
-
65
-
66
-
67
-
68
-
69
-
70
-
71
-
72
-
73
-
74
-
75
-
76
-
77
-
78
-
79
-
80
-
81
-
82
-
83
-
84
-
85
-
86
-
87
-
88
-
89
-
90
-
91
-
92
-
93
-
94
-
95
-
96
-
97
-
98
-
99
-
100
-
101
-
102
-
103
-
104
-
105
-
106
-
107
-
108
-
109
-
110
-
111
-
112
-
113
-
114
-
115
-
116
-
117
-
118
-
119
-
120
-
121
-
122
-
123
-
124
-
125
-
126
-
127
-
128
-
129
-
130
-
131
-
132
-
133
-
134
-
135
-
136
-
137
-
138
-
139
-
140
-
141
-
142
-
143
-
144
-
145
-
146
-
147
-
148
-
149
-
150
-
151
-
152
-
153
-
154
-
155
-
156
-
157
-
158
-
159
-
160
-
161
-
162
-
163
-
164
-
165
-
166
-
167
-
168
-
169
-
170
-
171
-
172
-
173
-
174
-
175
-
176
-
 177
177 -
 178
178 -
 179
179 -
 180
180 -
 181
181 -
 182
182 -
 183
183 -
 184
184 -
 185
185 -
 186
186 -
 187
187 -
 188
188 -
 189
189 -
 190
190 -
 191
191 -
 192
192 -
 193
193 -
 194
194 -
 195
195 -
 196
196 -
 197
197 -
198
-
199
-
200
-
201
-
202
-
203
-
204
-
205
-
206
-
207
-
208
-
209
-
210
-
211
-
212
-
213
-
214
-
215
-
216
-
217
-
218
-
219
-
220
-
221
-
222
-
223
-
224
-
225
-
226
-
227
-
228
-
229
-
230
-
231
-
232
-
233
-
234
-
235
-
236
-
237
-
238
-
239
-
240
-
241
-
242
-
243
-
244
-
245
-
246
-
247
-
248
-
249
-
250
-
251
-
252
-
253
-
254
-
255
-
256
-
257
-
258
-
259
-
260
-
261
-
262
-
263
-
264
-
265
-
266
-
267
-
268
-
269
-
270
-
271
-
272
-
273
-
274
-
275
-
276
-
277
-
278
-
279
-
280
-
281
-
282
-
283
-
284
 |
 |

177
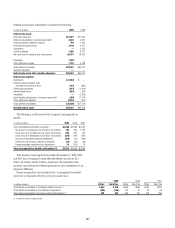
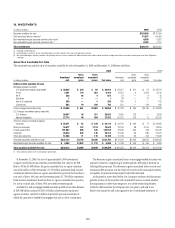
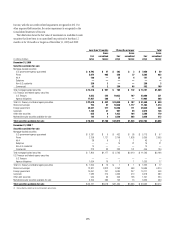
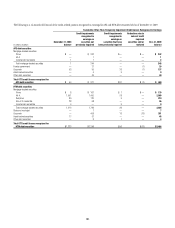
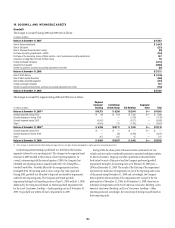
Debt Securities Held-to-Maturity
The carrying value and fair value of securities held-to-maturity (HTM) at December 31, 2009 and December 31, 2008 were as follows:
In millions of dollars
Amortized
cost (1)
Net unrealized
loss
recognized
in AOCI
Carrying
value (2)
Gross
unrecognized
gains
Gross
unrecognized
losses
Fair
value
December 31, 2009
Debt securities held-to-maturity
Mortgage-backed securities
U.S. government-agency guaranteed $ — $ — $ — $ — $ — $ —
Prime 6,118 1,151 4,967 317 5 5,279
Alt-A 14,710 4,276 10,434 905 243 11,096
Subprime 1,087 128 959 77 100 936
Non-U.S. residential 9,002 1,119 7,883 469 134 8,218
Commercial 1,303 45 1,258 1 208 1,051
Total mortgage-backed securities $ 32,220 $6,719 $25,501 $1,769 $ 690 $ 26,580
U.S. Treasury and federal agency securities
U.S. Treasury — — — — — —
Agency and direct obligations — — — — — —
Total U.S. Treasury and federal agency securities $ — $ — $ — $ — $ — $ —
State and municipal 3,067 147 2,920 92 113 2,899
Corporate 7,457 264 7,193 524 182 7,535
Asset-backed securities 16,348 435 15,913 567 496 15,984
Other debt securities — — — — — —
Total debt securities held-to-maturity $59,092 $7,565 $51,527 $2,952 $ 1,481 $ 52,998
December 31, 2008
Debt securities held-to-maturity
Mortgage-backed securities
U.S. government-agency guaranteed $ — $ — $ — $ — $ — $ —
Prime 7,481 1,436 6,045 — 623 5,422
Alt-A 16,658 4,216 12,442 23 1,802 10,663
Subprime 1,368 125 1,243 15 163 1,095
Non-U.S. residential 10,496 1,128 9,368 5 397 8,976
Commercial 1,021 — 1,021 — 130 891
Total mortgage-backed securities $ 37,024 $6,905 $30,119 $ 43 $ 3,115 $ 27,047
U.S. Treasury and federal agency securities
U.S. Treasury 1 — 1 — — 1
Agency and direct obligations — — — — — —
Total U.S. Treasury and federal agency securities $ 1 $ — $ 1 $ — $ — $ 1
State and municipal 3,371 183 3,188 14 253 2,949
Corporate 6,906 175 6,731 130 305 6,556
Asset-backed securities 22,698 415 22,283 86 555 21,814
Other debt securities 2,478 341 2,137 — 127 2,010
Total debt securities held-to-maturity $ 72,478 $8,019 $64,459 $ 273 $ 4,355 $ 60,377
(1) For securities transferred to HTM from Trading account assets, amortized cost is defined as the fair value amount of the securities at the date of transfer plus any accretion income and less any impairments recognized
in earnings subsequent to transfer. For securities transferred to HTM from AFS, amortized cost is defined as the original purchase cost, plus or minus any accretion or amortization of interest, less any impairment
previously recognized in earnings.
(2) HTM securities are carried on the Consolidated Balance Sheet at amortized cost and the changes in the value of these securities, other than impairment charges, are not reported on the financial statements.
The net unrealized losses classified in Accumulated other comprehensive
income (AOCI) relate to debt securities reclassified from AFS investments to
HTM investments, and to additional declines in fair value for HTM securities
that suffer credit impairment. The balance was $7.6 billion as of December
31, 2009, compared to $8.0 billion as of December 31, 2008. This balance is
amortized over the remaining life of the related securities as an adjustment
of yield in a manner consistent with the accretion of discount on the same
transferred debt securities. This will have no impact on the Company’s net
income because the amortization of the unrealized holding loss reported in
equity will offset the effect on interest income of the accretion of the discount
on these securities.