Citibank 2009 Annual Report Download - page 209
Download and view the complete annual report
Please find page 209 of the 2009 Citibank annual report below. You can navigate through the pages in the report by either clicking on the pages listed below, or by using the keyword search tool below to find specific information within the annual report.-
 1
1 -
2
-
3
-
4
-
5
-
6
-
7
-
8
-
9
-
10
-
11
-
12
-
13
-
14
-
15
-
16
-
17
-
18
-
19
-
20
-
21
-
22
-
23
-
24
-
25
-
26
-
27
-
28
-
29
-
30
-
31
-
32
-
33
-
34
-
35
-
36
-
37
-
38
-
39
-
40
-
41
-
42
-
43
-
44
-
45
-
46
-
47
-
48
-
49
-
50
-
51
-
52
-
53
-
54
-
55
-
56
-
57
-
58
-
59
-
60
-
61
-
62
-
63
-
64
-
65
-
66
-
67
-
68
-
69
-
70
-
71
-
72
-
73
-
74
-
75
-
76
-
77
-
78
-
79
-
80
-
81
-
82
-
83
-
84
-
85
-
86
-
87
-
88
-
89
-
90
-
91
-
92
-
93
-
94
-
95
-
96
-
97
-
98
-
99
-
100
-
101
-
102
-
103
-
104
-
105
-
106
-
107
-
108
-
109
-
110
-
111
-
112
-
113
-
114
-
115
-
116
-
117
-
118
-
119
-
120
-
121
-
122
-
123
-
124
-
125
-
126
-
127
-
128
-
129
-
130
-
131
-
132
-
133
-
134
-
135
-
136
-
137
-
138
-
139
-
140
-
141
-
142
-
143
-
144
-
145
-
146
-
147
-
148
-
149
-
150
-
151
-
152
-
153
-
154
-
155
-
156
-
157
-
158
-
159
-
160
-
161
-
162
-
163
-
164
-
165
-
166
-
167
-
168
-
169
-
170
-
171
-
172
-
173
-
174
-
175
-
176
-
177
-
178
-
179
-
180
-
181
-
182
-
183
-
184
-
185
-
186
-
187
-
188
-
189
-
190
-
191
-
192
-
193
-
194
-
195
-
196
-
197
-
198
-
 199
199 -
 200
200 -
 201
201 -
 202
202 -
 203
203 -
 204
204 -
 205
205 -
 206
206 -
 207
207 -
 208
208 -
 209
209 -
 210
210 -
 211
211 -
 212
212 -
 213
213 -
 214
214 -
 215
215 -
 216
216 -
 217
217 -
 218
218 -
 219
219 -
220
-
221
-
222
-
223
-
224
-
225
-
226
-
227
-
228
-
229
-
230
-
231
-
232
-
233
-
234
-
235
-
236
-
237
-
238
-
239
-
240
-
241
-
242
-
243
-
244
-
245
-
246
-
247
-
248
-
249
-
250
-
251
-
252
-
253
-
254
-
255
-
256
-
257
-
258
-
259
-
260
-
261
-
262
-
263
-
264
-
265
-
266
-
267
-
268
-
269
-
270
-
271
-
272
-
273
-
274
-
275
-
276
-
277
-
278
-
279
-
280
-
281
-
282
-
283
-
284
 |
 |

199
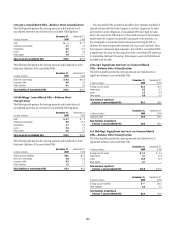
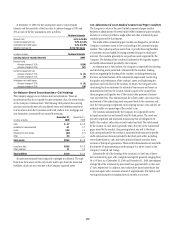
Citicorp’s Consolidated VIEs—Balance Sheet Classification
The following table presents the carrying amounts and classifications of
consolidated assets that are collateral for consolidated VIE obligations:
In billions of dollars
December 31,
2009
December 31,
2008
Cash $ — $ 0.7
Trading account assets 3.7 4.3
Investments 9.8 12.5
Loans 0.1 0.5
Other assets 1.9 1.7
Total assets of consolidated VIEs $15.5 $19.7
The following table presents the carrying amounts and classification of the
third-party liabilities of the consolidated VIEs:
In billions of dollars
December 31,
2009
December 31,
2008
Short-term borrowings $ 9.5 $14.2
Long-term debt 4.6 5.6
Other liabilities 0.1 0.9
Total liabilities of consolidated VIEs $14.2 $20.7
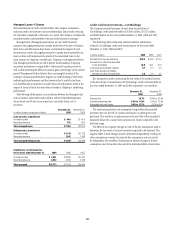
Citi Holdings’ Consolidated VIEs—Balance Sheet
Classification
The following table presents the carrying amounts and classifications of
consolidated assets that are collateral for consolidated VIE obligations:
In billions of dollars
December 31,
2009
December 31,
2008
Cash $ 0.7 $ 1.2
Trading account assets 9.5 16.6
Investments 2.7 3.3
Loans 0.4 2.1
Other assets 0.5 0.7
Total assets of consolidated VIEs $13.8 $23.9
The following table presents the carrying amounts and classification of the
third-party liabilities of the consolidated VIEs:
In billions of dollars
December 31,
2009
December 31,
2008
Trading account liabilities $0.2 $0.5
Short-term borrowings 2.6 2.8
Long-term debt 0.3 1.2
Other liabilities 1.3 2.1
Total liabilities of consolidated VIEs $4.4 $6.6
The consolidated VIEs included in the tables above represent hundreds of
separate entities with which the Company is involved. In general, the third-
party investors in the obligations of consolidated VIEs have legal recourse
only to the assets of the VIEs and do not have such recourse to the Company,
except where the Company has provided a guarantee to the investors or is
the counterparty to certain derivative transactions involving the VIE. In
addition, the assets are generally restricted only to pay such liabilities. Thus,
the Company’s maximum legal exposure to loss related to consolidated VIEs
is significantly less than the carrying value of the consolidated VIE assets due
to outstanding third-party financing. Intercompany assets and liabilities are
excluded from the table.
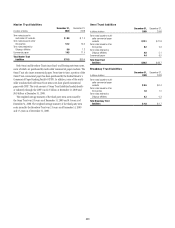
Citicorp’s Significant Interests in Unconsolidated
VIEs—Balance Sheet Classification
The following tables present the carrying amounts and classification of
significant interests in unconsolidated VIEs:
In billions of dollars
December 31,
2009
December 31,
2008
Trading account assets $3.2 $1.9
Investments 0.2 0.2
Loans 2.3 3.5
Other assets 0.5 0.4
Total assets of significant
interests in unconsolidated VIEs $6.2 $6.0
In billions of dollars
December 31,
2009
December 31,
2008
Long-term debt $0.5 $0.4
Total liabilities of significant
interests in unconsolidated VIEs $0.5 $0.4
Citi Holdings’ Significant Interests in Unconsolidated
VIEs—Balance Sheet Classification
The following tables present the carrying amounts and classification of
significant interests in unconsolidated VIEs:
In billions of dollars
December 31,
2009
December 31,
2008
Trading account assets $ 3.1 $ 4.4
Investments 9.1 10.8
Loans 10.5 12.4
Other assets 0.1 —
Total assets of significant
interests in unconsolidated VIEs $22.8 $ 27.6
In billions of dollars
December 31,
2009
December 31,
2008
Trading account liabilities $ — $0.2
Other liabilities 0.4 0.6
Total liabilities of significant
interests in unconsolidated VIEs $0.4 $0.8