Citibank 2009 Annual Report Download - page 221
Download and view the complete annual report
Please find page 221 of the 2009 Citibank annual report below. You can navigate through the pages in the report by either clicking on the pages listed below, or by using the keyword search tool below to find specific information within the annual report.-
 1
1 -
2
-
3
-
4
-
5
-
6
-
7
-
8
-
9
-
10
-
11
-
12
-
13
-
14
-
15
-
16
-
17
-
18
-
19
-
20
-
21
-
22
-
23
-
24
-
25
-
26
-
27
-
28
-
29
-
30
-
31
-
32
-
33
-
34
-
35
-
36
-
37
-
38
-
39
-
40
-
41
-
42
-
43
-
44
-
45
-
46
-
47
-
48
-
49
-
50
-
51
-
52
-
53
-
54
-
55
-
56
-
57
-
58
-
59
-
60
-
61
-
62
-
63
-
64
-
65
-
66
-
67
-
68
-
69
-
70
-
71
-
72
-
73
-
74
-
75
-
76
-
77
-
78
-
79
-
80
-
81
-
82
-
83
-
84
-
85
-
86
-
87
-
88
-
89
-
90
-
91
-
92
-
93
-
94
-
95
-
96
-
97
-
98
-
99
-
100
-
101
-
102
-
103
-
104
-
105
-
106
-
107
-
108
-
109
-
110
-
111
-
112
-
113
-
114
-
115
-
116
-
117
-
118
-
119
-
120
-
121
-
122
-
123
-
124
-
125
-
126
-
127
-
128
-
129
-
130
-
131
-
132
-
133
-
134
-
135
-
136
-
137
-
138
-
139
-
140
-
141
-
142
-
143
-
144
-
145
-
146
-
147
-
148
-
149
-
150
-
151
-
152
-
153
-
154
-
155
-
156
-
157
-
158
-
159
-
160
-
161
-
162
-
163
-
164
-
165
-
166
-
167
-
168
-
169
-
170
-
171
-
172
-
173
-
174
-
175
-
176
-
177
-
178
-
179
-
180
-
181
-
182
-
183
-
184
-
185
-
186
-
187
-
188
-
189
-
190
-
191
-
192
-
193
-
194
-
195
-
196
-
197
-
198
-
199
-
200
-
201
-
202
-
203
-
204
-
205
-
206
-
207
-
208
-
209
-
210
-
 211
211 -
 212
212 -
 213
213 -
 214
214 -
 215
215 -
 216
216 -
 217
217 -
 218
218 -
 219
219 -
 220
220 -
 221
221 -
 222
222 -
 223
223 -
 224
224 -
 225
225 -
 226
226 -
 227
227 -
 228
228 -
 229
229 -
 230
230 -
 231
231 -
232
-
233
-
234
-
235
-
236
-
237
-
238
-
239
-
240
-
241
-
242
-
243
-
244
-
245
-
246
-
247
-
248
-
249
-
250
-
251
-
252
-
253
-
254
-
255
-
256
-
257
-
258
-
259
-
260
-
261
-
262
-
263
-
264
-
265
-
266
-
267
-
268
-
269
-
270
-
271
-
272
-
273
-
274
-
275
-
276
-
277
-
278
-
279
-
280
-
281
-
282
-
283
-
284
 |
 |

211
Since inception of many CDO transactions, the subordinate tranches of
the CDOs have diminished significantly in value and in rating. The declines
in value of the subordinate tranches and in the super senior tranches indicate
that the super-senior tranches are now exposed to a significant portion
of the expected losses of the CDOs, based on current market assumptions.
The Company evaluates these transactions for consolidation when
reconsideration events occur.
Upon a reconsideration event, the Company is at risk for consolidation
only if the Company owns a majority of either a single tranche or a group of
tranches that absorb the remaining risk of the CDO. Due to reconsideration
events during 2007, 2008 and 2009, the Company has consolidated 24 of the
39 CDOs/CLOs in which the Company holds a majority of the senior interests
of the transaction.
The Company continues to monitor its involvement in unconsolidated
VIEs and if the Company were to acquire additional interests in these vehicles
or if the CDOs’ contractual arrangements were to be changed to reallocate
expected losses or residual returns among the various interest holders, the
Company may be required to consolidate the CDOs. For cash CDOs, the net
result of such consolidation would be to gross up the Company’s balance
sheet by the current fair value of the subordinate securities held by third
parties, which amounts are not considered material. For synthetic CDOs,
the net result of such consolidation may reduce the Company’s balance
sheet by eliminating intercompany derivative receivables and payables in
consolidation.
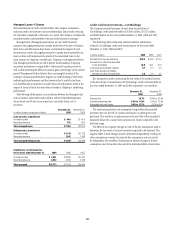
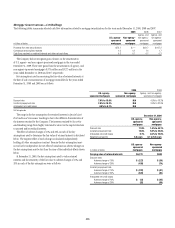
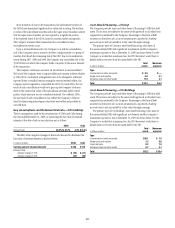
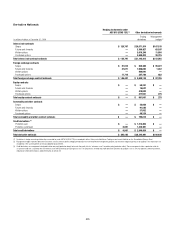
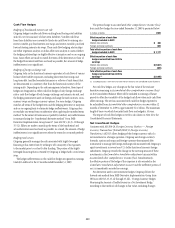
Key Assumptions and Retained Interests—Citi Holdings
The key assumptions, used for the securitization of CDOs and CLOs during
the year ended December 31, 2009, in measuring the fair value of retained
interests at the date of sale or securitization are as follows:
CDOs CLOs
Discount rate 36.4% to 47.2% 4.3% to 6.3%
The effect of two negative changes in discount rates used to determine the
fair value of retained interests is disclosed below.
In millions of dollars CDOs CLOs
Carrying value of retained interests $186 $ 714
Discount rates
Adverse change of 10% $ (25) $ (11)
Adverse change of 20% (47) (22)
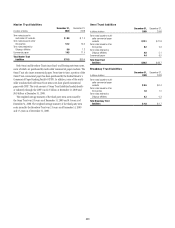
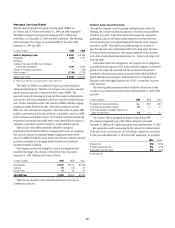
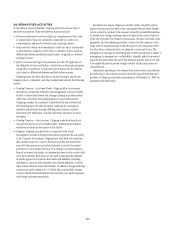
Asset-Based Financing—Citicorp
The Company provides loans and other forms of financing to VIEs that hold
assets. Those loans are subject to the same credit approvals as all other loans
originated or purchased by the Company. Financings in the form of debt
securities or derivatives are, in most circumstances, reported in Trading
account assets and accounted for at fair value through earnings.
The primary types of Citicorp’s asset-based financing, total assets of
the unconsolidated VIEs with significant involvement and the Company’s
maximum exposure to loss at December 31, 2009 are shown below. For the
Company to realize that maximum loss, the VIE (borrower) would have to
default with no recovery from the assets held by the VIE.
In billions of dollars
Total
assets
Maximum
exposure
Type
Commercial and other real estate $ 0.5 $ —
Hedge funds and equities 5.9 3.1
Airplanes, ships and other assets 11.9 2.1
Total $18.3 $ 5.2
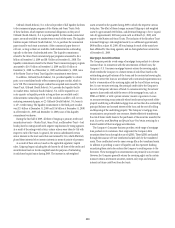
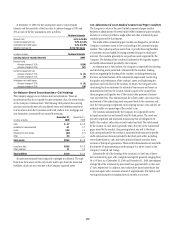
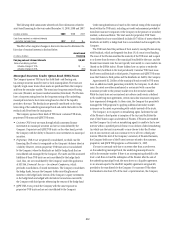
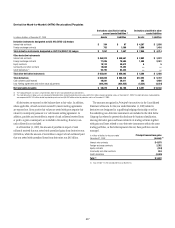
Asset-Based Financing—Citi Holdings
The Company provides loans and other forms of financing to VIEs that hold
assets. Those loans are subject to the same credit approvals as all other loans
originated or purchased by the Company. Financings in the form of debt
securities or derivatives are, in most circumstances, reported in Trading
account assets and accounted for at fair value through earnings.
The primary types of Citi Holdings’ asset-based financing, total assets of
the unconsolidated VIEs with significant involvement and the Company’s
maximum exposure to loss at December 31, 2009 are shown below. For the
Company to realize that maximum loss, the VIE (borrower) would have to
default with no recovery from the assets held by the VIE.
In billions of dollars
Total
assets
Maximum
exposure
Type
Commercial and other real estate $36.1 $ 7.5
Hedge funds and equities 2.2 0.8
Corporate loans 8.2 7.0
Airplanes, ships and other assets 5.7 3.1
Total $52.2 $18.4