Citibank 2009 Annual Report Download - page 232
Download and view the complete annual report
Please find page 232 of the 2009 Citibank annual report below. You can navigate through the pages in the report by either clicking on the pages listed below, or by using the keyword search tool below to find specific information within the annual report.-
 1
1 -
2
-
3
-
4
-
5
-
6
-
7
-
8
-
9
-
10
-
11
-
12
-
13
-
14
-
15
-
16
-
17
-
18
-
19
-
20
-
21
-
22
-
23
-
24
-
25
-
26
-
27
-
28
-
29
-
30
-
31
-
32
-
33
-
34
-
35
-
36
-
37
-
38
-
39
-
40
-
41
-
42
-
43
-
44
-
45
-
46
-
47
-
48
-
49
-
50
-
51
-
52
-
53
-
54
-
55
-
56
-
57
-
58
-
59
-
60
-
61
-
62
-
63
-
64
-
65
-
66
-
67
-
68
-
69
-
70
-
71
-
72
-
73
-
74
-
75
-
76
-
77
-
78
-
79
-
80
-
81
-
82
-
83
-
84
-
85
-
86
-
87
-
88
-
89
-
90
-
91
-
92
-
93
-
94
-
95
-
96
-
97
-
98
-
99
-
100
-
101
-
102
-
103
-
104
-
105
-
106
-
107
-
108
-
109
-
110
-
111
-
112
-
113
-
114
-
115
-
116
-
117
-
118
-
119
-
120
-
121
-
122
-
123
-
124
-
125
-
126
-
127
-
128
-
129
-
130
-
131
-
132
-
133
-
134
-
135
-
136
-
137
-
138
-
139
-
140
-
141
-
142
-
143
-
144
-
145
-
146
-
147
-
148
-
149
-
150
-
151
-
152
-
153
-
154
-
155
-
156
-
157
-
158
-
159
-
160
-
161
-
162
-
163
-
164
-
165
-
166
-
167
-
168
-
169
-
170
-
171
-
172
-
173
-
174
-
175
-
176
-
177
-
178
-
179
-
180
-
181
-
182
-
183
-
184
-
185
-
186
-
187
-
188
-
189
-
190
-
191
-
192
-
193
-
194
-
195
-
196
-
197
-
198
-
199
-
200
-
201
-
202
-
203
-
204
-
205
-
206
-
207
-
208
-
209
-
210
-
211
-
212
-
213
-
214
-
215
-
216
-
217
-
218
-
219
-
220
-
221
-
 222
222 -
 223
223 -
 224
224 -
 225
225 -
 226
226 -
 227
227 -
 228
228 -
 229
229 -
 230
230 -
 231
231 -
 232
232 -
 233
233 -
 234
234 -
 235
235 -
 236
236 -
 237
237 -
 238
238 -
 239
239 -
 240
240 -
 241
241 -
 242
242 -
243
-
244
-
245
-
246
-
247
-
248
-
249
-
250
-
251
-
252
-
253
-
254
-
255
-
256
-
257
-
258
-
259
-
260
-
261
-
262
-
263
-
264
-
265
-
266
-
267
-
268
-
269
-
270
-
271
-
272
-
273
-
274
-
275
-
276
-
277
-
278
-
279
-
280
-
281
-
282
-
283
-
284
 |
 |

222
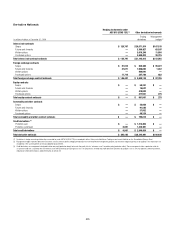
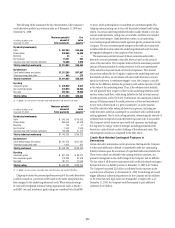
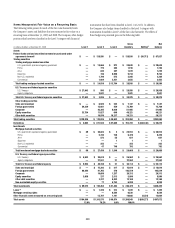
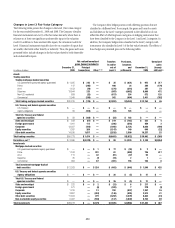
The following tables summarize the key characteristics of the Company’s
credit derivative portfolio as protection seller as of December 31, 2009 and
December 31, 2008:
In millions of dollars as of
December 31, 2009
Maximum potential
amount of
future payments
Fair
value
payable (1)
By industry/counterparty
Bank $ 807,484 $34,666
Broker-dealer 340,949 16,309
Monoline 33 —
Non-financial 13,221 262
Insurance and other financial institutions 52,366 7,025
Total by industry/counterparty $1,214,053 $58,262
By instrument
Credit default swaps and options $1,213,208 $57,987
Total return swaps and other 845 275
Total by instrument $1,214,053 $58,262
By rating
Investment grade $ 576,930 9,632
Non-investment grade 339,920 28,664
Not rated 297,203 19,966
Total by rating $1,214,053 $58,262
(1) In addition, fair value amounts receivable under credit derivatives sold were $24,234 million.
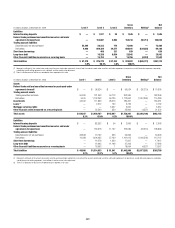
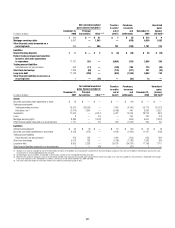
In millions of dollars as of
December 31, 2008
Maximum potential
amount of
future payments
Fair
value
payable (1)
By industry/counterparty
Bank $ 943,949 $118,428
Broker-dealer 365,664 55,458
Monoline 139 91
Non-financial 7,540 2,556
Insurance and other financial institutions 125,988 21,700
Total by industry/counterparty $1,443,280 $198,233
By instrument
Credit default swaps and options $1,441,375 $197,981
Total return swaps and other 1,905 252
Total by instrument $1,443,280 $198,233
By rating
Investment grade $ 851,426 $ 83,672
Non-investment grade 410,483 87,508
Not rated 181,371 27,053
Total by rating $1,443,280 $198,233
(1) In addition, fair value amounts receivable under credit derivatives sold were $5,890 million.
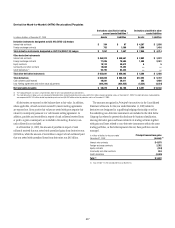
Citigroup evaluates the payment/performance risk of the credit derivatives
to which it stands as a protection seller based on the credit rating which has
been assigned to the underlying referenced credit. Where external ratings
by nationally recognized statistical rating organizations (such as Moody’s
and S&P) are used, investment grade ratings are considered to be Baa/BBB
or above, while anything below is considered non-investment grade. The
Citigroup internal ratings are in line with the related external credit rating
system. On certain underlying referenced credit, mainly related to over-the-
counter credit derivatives, ratings are not available, and these are included
in the not-rated category. Credit derivatives written on an underlying
non-investment grade referenced credit represent greater payment risk to the
Company. The non-investment grade category in the table above primarily
includes credit derivatives where the underlying referenced entity has been
downgraded subsequent to the inception of the derivative.
The maximum potential amount of future payments under credit
derivative contracts presented in the table above is based on the notional
value of the derivatives. The Company believes that the maximum potential
amount of future payments for credit protection sold is not representative
of the actual loss exposure based on historical experience. This amount
has not been reduced by the Company’s rights to the underlying assets and
the related cash flows. In accordance with most credit derivative contracts,
should a credit event (or settlement trigger) occur, the Company is usually
liable for the difference between the protection sold and the recourse it holds
in the value of the underlying assets. Thus, if the reference entity defaults,
Citi will generally have a right to collect on the underlying reference credit
and any related cash flows, while being liable for the full notional amount
of credit protection sold to the buyer. Furthermore, this maximum potential
amount of future payments for credit protection sold has not been reduced
for any cash collateral paid to a given counterparty, as such payments
would be calculated after netting all derivative exposures, including any
credit derivatives with that counterparty in accordance with a related master
netting agreement. Due to such netting processes, determining the amount of
collateral that corresponds to credit derivative exposures only is not possible.
The Company actively monitors open credit risk exposures, and manages
this exposure by using a variety of strategies including purchased credit
derivatives, cash collateral or direct holdings of the referenced assets. This
risk mitigation activity is not captured in the table above.
Credit-Risk-Related Contingent Features in
Derivatives
Certain derivative instruments contain provisions that require the Company
to either post additional collateral or immediately settle any outstanding
liability balances upon the occurrence of a specified credit-risk-related event.
These events, which are defined by the existing derivative contracts, are
primarily downgrades in the credit ratings of the Company and its affiliates.
The fair value of all derivative instruments with credit-risk-related contingent
features that are in a liability position at December 31, 2009 is $17 billion.
The Company has posted $11 billion as collateral for this exposure in the
normal course of business as of December 31, 2009. Each downgrade would
trigger additional collateral requirements for the Company and its affiliates.
In the event that each legal entity was downgraded a single notch as of
December 31, 2009, the Company would be required to post additional
collateral of $2.6 billion.