Citibank 2009 Annual Report Download - page 268
Download and view the complete annual report
Please find page 268 of the 2009 Citibank annual report below. You can navigate through the pages in the report by either clicking on the pages listed below, or by using the keyword search tool below to find specific information within the annual report.-
 1
1 -
2
-
3
-
4
-
5
-
6
-
7
-
8
-
9
-
10
-
11
-
12
-
13
-
14
-
15
-
16
-
17
-
18
-
19
-
20
-
21
-
22
-
23
-
24
-
25
-
26
-
27
-
28
-
29
-
30
-
31
-
32
-
33
-
34
-
35
-
36
-
37
-
38
-
39
-
40
-
41
-
42
-
43
-
44
-
45
-
46
-
47
-
48
-
49
-
50
-
51
-
52
-
53
-
54
-
55
-
56
-
57
-
58
-
59
-
60
-
61
-
62
-
63
-
64
-
65
-
66
-
67
-
68
-
69
-
70
-
71
-
72
-
73
-
74
-
75
-
76
-
77
-
78
-
79
-
80
-
81
-
82
-
83
-
84
-
85
-
86
-
87
-
88
-
89
-
90
-
91
-
92
-
93
-
94
-
95
-
96
-
97
-
98
-
99
-
100
-
101
-
102
-
103
-
104
-
105
-
106
-
107
-
108
-
109
-
110
-
111
-
112
-
113
-
114
-
115
-
116
-
117
-
118
-
119
-
120
-
121
-
122
-
123
-
124
-
125
-
126
-
127
-
128
-
129
-
130
-
131
-
132
-
133
-
134
-
135
-
136
-
137
-
138
-
139
-
140
-
141
-
142
-
143
-
144
-
145
-
146
-
147
-
148
-
149
-
150
-
151
-
152
-
153
-
154
-
155
-
156
-
157
-
158
-
159
-
160
-
161
-
162
-
163
-
164
-
165
-
166
-
167
-
168
-
169
-
170
-
171
-
172
-
173
-
174
-
175
-
176
-
177
-
178
-
179
-
180
-
181
-
182
-
183
-
184
-
185
-
186
-
187
-
188
-
189
-
190
-
191
-
192
-
193
-
194
-
195
-
196
-
197
-
198
-
199
-
200
-
201
-
202
-
203
-
204
-
205
-
206
-
207
-
208
-
209
-
210
-
211
-
212
-
213
-
214
-
215
-
216
-
217
-
218
-
219
-
220
-
221
-
222
-
223
-
224
-
225
-
226
-
227
-
228
-
229
-
230
-
231
-
232
-
233
-
234
-
235
-
236
-
237
-
238
-
239
-
240
-
241
-
242
-
243
-
244
-
245
-
246
-
247
-
248
-
249
-
250
-
251
-
252
-
253
-
254
-
255
-
256
-
257
-
 258
258 -
 259
259 -
 260
260 -
 261
261 -
 262
262 -
 263
263 -
 264
264 -
 265
265 -
 266
266 -
 267
267 -
 268
268 -
 269
269 -
 270
270 -
 271
271 -
 272
272 -
 273
273 -
 274
274 -
 275
275 -
 276
276 -
 277
277 -
 278
278 -
279
-
280
-
281
-
282
-
283
-
284
 |
 |

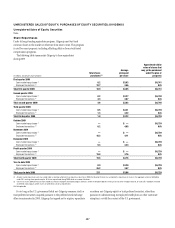
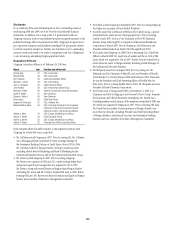
258
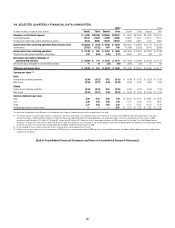
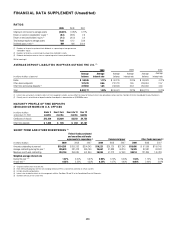
FINANCIAL DATA SUPPLEMENT (Unaudited)
RATIOS
2009 2008 2007
Citigroup’s net income to average assets (0.08)% (1.28)% 0.17%
Return on common stockholders’ equity (1) (9.4) (28.8) 2.9
Return on total stockholders’ equity (2) (1.1) (20.9) 3.0
Total average equity to average assets 7.64 6.12 5.66
Dividends payout ratio (3) NM NM 300.0
(1) Based on net income less preferred stock dividends as a percentage of average common
stockholders’ equity.
(2) Based on net income as a percentage of average total stockholders’ equity.
(3) Dividends declared per common share as a percentage of net income per diluted share.
NM Not meaningful
AVERAGE DEPOSIT LIABILITIES IN OFFICES OUTSIDE THE U.S. (1)
2009 2008 2007
In millions of dollars at year end
Average
balance
Average
interest rate
Average
balance
Average
interest rate
Average
balance
Average
interest rate
Banks $ 58,046 1.11% $ 60,315 3.25% $ 68,538 4.72%
Other demand deposits 187,478 0.66 212,781 1.85 208,634 2.57
Other time and savings deposits (2) 237,653 1.85 243,305 3.53 256,946 4.54
Total $ 483,177 1.30% $516,401 2.81% $534,118 3.79%
(1) Interest rates and amounts include the effects of risk management activities and also reflect the impact of the local interest rates prevailing in certain countries. See Note 24 to the Consolidated Financial Statements.
(2) Primarily consists of certificates of deposit and other time deposits in denominations of $100,000 or more.
MATURITY PROFILE OF TIME DEPOSITS
($100,000 OR MORE) IN U.S. OFFICES
In millions of dollars
at December 31, 2009
Under 3
months
Over 3 to 6
months
Over 6 to 12
months
Over 12
months
Certificates of deposit $13,439 $5,609 $5,252 $ 4,752
Other time deposits $ 1,845 $ 106 $ 204 $ 1,181
SHORT-TERM AND OTHER BORROWINGS (1)
Federal funds purchased
and securities sold under
agreements to repurchase (2) Commercial paper Other funds borrowed
(2)
In millions of dollars 2009 2008 2007 2009 2008 2007 2009 2008 2007
Amounts outstanding at year end $154,281 $205,293 $304,243 $10,223 $29,125 $37,343 $58,656 $ 97,566 $109,145
Average outstanding during the year (3) 205,633 281,478 385,199 24,667 31,888 44,274 76,529 82,587 93,302
Maximum month-end outstanding 252,154 354,685 441,844 36,884 41,212 57,303 99,814 121,834 145,783
Weighted-average interest rate
During the year (3) (4) 1.67% 4.00% 5.97% 0.99% 3.10% 5.29% 1.54% 1.70% 2.79%
At year end (5) 0.85% 2.22% 4.52% 0.34% 1.67% 4.92% 0.66% 2.40% 3.62%
(1) Original maturities of less than one year.
(2) Rates reflect prevailing local interest rates including inflationary effects and monetary correction in certain countries.
(3) Excludes discontinued operations.
(4) Interest rates include the effects of risk management activities. See Notes 20 and 24 to the Consolidated Financial Statements.
(5) Based on contractual rates at year end.