Citibank 2009 Annual Report Download - page 247
Download and view the complete annual report
Please find page 247 of the 2009 Citibank annual report below. You can navigate through the pages in the report by either clicking on the pages listed below, or by using the keyword search tool below to find specific information within the annual report.-
 1
1 -
2
-
3
-
4
-
5
-
6
-
7
-
8
-
9
-
10
-
11
-
12
-
13
-
14
-
15
-
16
-
17
-
18
-
19
-
20
-
21
-
22
-
23
-
24
-
25
-
26
-
27
-
28
-
29
-
30
-
31
-
32
-
33
-
34
-
35
-
36
-
37
-
38
-
39
-
40
-
41
-
42
-
43
-
44
-
45
-
46
-
47
-
48
-
49
-
50
-
51
-
52
-
53
-
54
-
55
-
56
-
57
-
58
-
59
-
60
-
61
-
62
-
63
-
64
-
65
-
66
-
67
-
68
-
69
-
70
-
71
-
72
-
73
-
74
-
75
-
76
-
77
-
78
-
79
-
80
-
81
-
82
-
83
-
84
-
85
-
86
-
87
-
88
-
89
-
90
-
91
-
92
-
93
-
94
-
95
-
96
-
97
-
98
-
99
-
100
-
101
-
102
-
103
-
104
-
105
-
106
-
107
-
108
-
109
-
110
-
111
-
112
-
113
-
114
-
115
-
116
-
117
-
118
-
119
-
120
-
121
-
122
-
123
-
124
-
125
-
126
-
127
-
128
-
129
-
130
-
131
-
132
-
133
-
134
-
135
-
136
-
137
-
138
-
139
-
140
-
141
-
142
-
143
-
144
-
145
-
146
-
147
-
148
-
149
-
150
-
151
-
152
-
153
-
154
-
155
-
156
-
157
-
158
-
159
-
160
-
161
-
162
-
163
-
164
-
165
-
166
-
167
-
168
-
169
-
170
-
171
-
172
-
173
-
174
-
175
-
176
-
177
-
178
-
179
-
180
-
181
-
182
-
183
-
184
-
185
-
186
-
187
-
188
-
189
-
190
-
191
-
192
-
193
-
194
-
195
-
196
-
197
-
198
-
199
-
200
-
201
-
202
-
203
-
204
-
205
-
206
-
207
-
208
-
209
-
210
-
211
-
212
-
213
-
214
-
215
-
216
-
217
-
218
-
219
-
220
-
221
-
222
-
223
-
224
-
225
-
226
-
227
-
228
-
229
-
230
-
231
-
232
-
233
-
234
-
235
-
236
-
 237
237 -
 238
238 -
 239
239 -
 240
240 -
 241
241 -
 242
242 -
 243
243 -
 244
244 -
 245
245 -
 246
246 -
 247
247 -
 248
248 -
 249
249 -
 250
250 -
 251
251 -
 252
252 -
 253
253 -
 254
254 -
 255
255 -
 256
256 -
 257
257 -
258
-
259
-
260
-
261
-
262
-
263
-
264
-
265
-
266
-
267
-
268
-
269
-
270
-
271
-
272
-
273
-
274
-
275
-
276
-
277
-
278
-
279
-
280
-
281
-
282
-
283
-
284
 |
 |

237
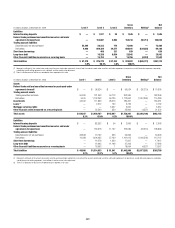
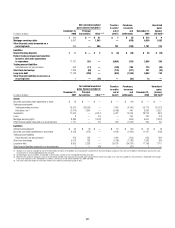
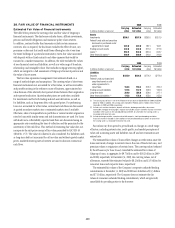
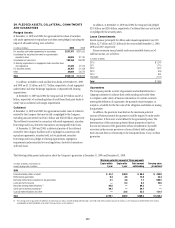
The following table provides information about certain credit products carried at fair value:
December 31, 2009 December 31, 2008(1)
In millions of dollars Trading assets Loans Trading assets Loans
Carrying amount reported on the Consolidated Balance Sheet $14,338 $945 $16,254 $2,315
Aggregate unpaid principal balance in excess of fair value 390 (44) 6,501 3
Balance of non-accrual loans or loans more than 90 days past due 312 — 77 —
Aggregate unpaid principal balance in excess of fair value for non-accrual loans or loans more than 90 days past due 267 — 190 —
(1) Reclassified to conform to current period’s presentation.
In addition to the amounts reported above, $200 million and $72 million
of unfunded loan commitments related to certain credit products selected for
fair value accounting were outstanding as of December 31, 2009 and 2008,
respectively.
Changes in fair value of funded and unfunded credit products are
classified in Principal transactions in the Company’s Consolidated
Statement of Income. Related interest revenue is measured based on the
contractual interest rates and reported as Interest revenue on trading
account assets or loans depending on their balance sheet classifications.
The changes in fair value for the years ended December 31, 2009 and 2008
due to instrument-specific credit risk totaled to a gain of $5.9 billion and
a loss of $6.0 billion, respectively.
Certain hybrid financial instruments
The Company has elected to apply fair value accounting for certain hybrid
financial assets and liabilities whose performance is linked to risks other than
interest rate, foreign exchange or inflation (e.g., equity, credit or commodity
risks). In addition, the Company has elected fair value accounting for
residual interests retained from securitizing certain financial assets.
The Company has elected fair value accounting for these instruments
because these exposures are considered to be trading-related positions and,
therefore, are managed on a fair value basis. In addition, the accounting for
these instruments is simplified under a fair value approach as it eliminates
the complicated operational requirements of bifurcating the embedded
derivatives from the host contracts and accounting for each separately. The
hybrid financial instruments are classified as Trading account assets,
Loans, Deposits, Trading account liabilities (for prepaid derivatives),
Short-term borrowings or Long-term debt on the Company’s Consolidated
Balance Sheet according to their legal form, while residual interests in
certain securitizations are classified as Trading account assets.
For hybrid financial instruments for which fair value accounting has
been elected and that are classified as Long-term debt, the aggregate unpaid
principal exceeded the aggregate fair value by $3.4 billion and $4.1 billion
as of December 31, 2009 and 2008, respectively. The difference for those
instruments classified as Loans is immaterial.
Changes in fair value for hybrid financial instruments, which in most
cases includes a component for accrued interest, are recorded in Principal
transactions in the Company’s Consolidated Statement of Income. Interest
accruals for certain hybrid instruments classified as trading assets are
recorded separately from the change in fair value as Interest revenue in the
Company’s Consolidated Statement of Income.
Certain investments in private equity and real estate
ventures and certain equity method investments
Citigroup invests in private equity and real estate ventures for the purpose
of earning investment returns and for capital appreciation. The Company
has elected the fair value option for certain of these ventures, because such
investments are considered similar to many private equity or hedge fund
activities in our investment companies, which are reported at fair value.
The fair value option brings consistency in the accounting and evaluation
of certain of these investments. All investments (debt and equity) in such
private equity and real estate entities are accounted for at fair value. These
investments are classified as Investments on Citigroup’s Consolidated
Balance Sheet.
Citigroup also holds various non-strategic investments in leveraged
buyout funds and other hedge funds that previously were required to be
accounted for under the equity method. The Company elected fair value
accounting to reduce operational and accounting complexity. Since the
funds account for all of their underlying assets at fair value, the impact of
applying the equity method to Citigroup’s investment in these funds was
equivalent to fair value accounting. Thus, this fair value election had no
impact on opening Retained earnings. These investments are classified as
Other assets on Citigroup’s Consolidated Balance Sheet.
Changes in the fair values of these investments are classified in Other
revenue in the Company’s Consolidated Statement of Income.