Citibank 2009 Annual Report Download - page 183
Download and view the complete annual report
Please find page 183 of the 2009 Citibank annual report below. You can navigate through the pages in the report by either clicking on the pages listed below, or by using the keyword search tool below to find specific information within the annual report.-
 1
1 -
2
-
3
-
4
-
5
-
6
-
7
-
8
-
9
-
10
-
11
-
12
-
13
-
14
-
15
-
16
-
17
-
18
-
19
-
20
-
21
-
22
-
23
-
24
-
25
-
26
-
27
-
28
-
29
-
30
-
31
-
32
-
33
-
34
-
35
-
36
-
37
-
38
-
39
-
40
-
41
-
42
-
43
-
44
-
45
-
46
-
47
-
48
-
49
-
50
-
51
-
52
-
53
-
54
-
55
-
56
-
57
-
58
-
59
-
60
-
61
-
62
-
63
-
64
-
65
-
66
-
67
-
68
-
69
-
70
-
71
-
72
-
73
-
74
-
75
-
76
-
77
-
78
-
79
-
80
-
81
-
82
-
83
-
84
-
85
-
86
-
87
-
88
-
89
-
90
-
91
-
92
-
93
-
94
-
95
-
96
-
97
-
98
-
99
-
100
-
101
-
102
-
103
-
104
-
105
-
106
-
107
-
108
-
109
-
110
-
111
-
112
-
113
-
114
-
115
-
116
-
117
-
118
-
119
-
120
-
121
-
122
-
123
-
124
-
125
-
126
-
127
-
128
-
129
-
130
-
131
-
132
-
133
-
134
-
135
-
136
-
137
-
138
-
139
-
140
-
141
-
142
-
143
-
144
-
145
-
146
-
147
-
148
-
149
-
150
-
151
-
152
-
153
-
154
-
155
-
156
-
157
-
158
-
159
-
160
-
161
-
162
-
163
-
164
-
165
-
166
-
167
-
168
-
169
-
170
-
171
-
172
-
 173
173 -
 174
174 -
 175
175 -
 176
176 -
 177
177 -
 178
178 -
 179
179 -
 180
180 -
 181
181 -
 182
182 -
 183
183 -
 184
184 -
 185
185 -
 186
186 -
 187
187 -
 188
188 -
 189
189 -
 190
190 -
 191
191 -
 192
192 -
 193
193 -
194
-
195
-
196
-
197
-
198
-
199
-
200
-
201
-
202
-
203
-
204
-
205
-
206
-
207
-
208
-
209
-
210
-
211
-
212
-
213
-
214
-
215
-
216
-
217
-
218
-
219
-
220
-
221
-
222
-
223
-
224
-
225
-
226
-
227
-
228
-
229
-
230
-
231
-
232
-
233
-
234
-
235
-
236
-
237
-
238
-
239
-
240
-
241
-
242
-
243
-
244
-
245
-
246
-
247
-
248
-
249
-
250
-
251
-
252
-
253
-
254
-
255
-
256
-
257
-
258
-
259
-
260
-
261
-
262
-
263
-
264
-
265
-
266
-
267
-
268
-
269
-
270
-
271
-
272
-
273
-
274
-
275
-
276
-
277
-
278
-
279
-
280
-
281
-
282
-
283
-
284
 |
 |

173
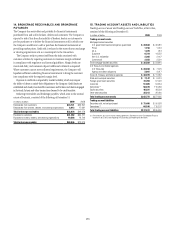
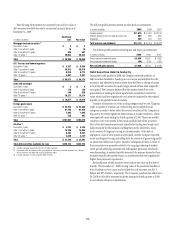
14. BROKERAGE RECEIVABLES AND BROKERAGE
PAYABLES
The Company has receivables and payables for financial instruments
purchased from and sold to brokers, dealers and customers. The Company is
exposed to risk of loss from the inability of brokers, dealers or customers to
pay for purchases or to deliver the financial instruments sold, in which case
the Company would have to sell or purchase the financial instruments at
prevailing market prices. Credit risk is reduced to the extent that an exchange
or clearing organization acts as a counterparty to the transaction.
The Company seeks to protect itself from the risks associated with
customer activities by requiring customers to maintain margin collateral
in compliance with regulatory and internal guidelines. Margin levels are
monitored daily, and customers deposit additional collateral as required.
Where customers cannot meet collateral requirements, the Company will
liquidate sufficient underlying financial instruments to bring the customer
into compliance with the required margin level.
Exposure to credit risk is impacted by market volatility, which may impair
the ability of clients to satisfy their obligations to the Company. Credit limits are
established and closely monitored for customers and brokers and dealers engaged
in forwards, futures and other transactions deemed to be credit sensitive.
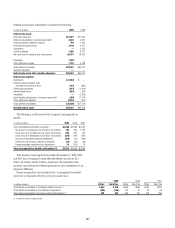
Brokerage receivables and brokerage payables, which arise in the normal
course of business, consisted of the following at December 31:
In millions of dollars 2009 2008
Receivables from customers $24,721 $26,297
Receivables from brokers, dealers, and clearing organizations 8,913 17,981
Total brokerage receivables $33,634 $44,278
Payables to customers $41,262 $54,167
Payables to brokers, dealers, and clearing organizations 19,584 16,749
Total brokerage payables $60,846 $70,916
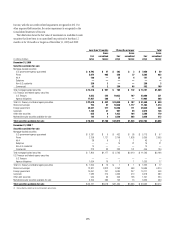
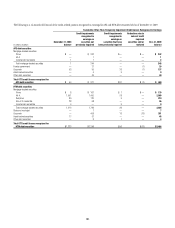
15. TRADING ACCOUNT ASSETS AND LIABILITIES
Trading account assets and Trading account liabilities, at fair value,
consisted of the following at December 31:
In millions of dollars 2009 2008
Trading account assets
Mortgage-backed securities
U.S. government sponsored agency guaranteed $ 20,638 $ 32,981
Prime 1,156 1,416
Alt-A 1,229 913
Subprime 9,734 14,552
Non-U.S. residential 2,368 2,447
Commercial 3,455 2,501
Total mortgage-backed securities $ 38,580 $ 54,810
U.S. Treasury and federal agencies
U.S. Treasuries $ 28,938 $ 7,370
Agency and direct obligations 2,041 4,017
Total U.S. Treasury and federal agencies $ 30,979 $ 11,387
State and municipal securities $ 7,147 $ 9,510
Foreign government securities 72,769 57,422
Corporate 51,985 54,654
Derivatives (1) 58,879 115,289
Equity securities 46,221 48,503
Other debt securities 36,213 26,060
Total trading account assets $342,773 $377,635
Trading account liabilities
Securities sold, not yet purchased $ 73,406 $ 50,693
Derivatives (1) 64,106 115,107
Total trading account liabilities $137,512 $165,800
(1) Presented net, pursuant to master netting agreements. See Note 24 to the Consolidated Financial
Statements for a discussion regarding the accounting and reporting for derivatives.