Citibank 2009 Annual Report Download - page 31
Download and view the complete annual report
Please find page 31 of the 2009 Citibank annual report below. You can navigate through the pages in the report by either clicking on the pages listed below, or by using the keyword search tool below to find specific information within the annual report.-
 1
1 -
2
-
3
-
4
-
5
-
6
-
7
-
8
-
9
-
10
-
11
-
12
-
13
-
14
-
15
-
16
-
17
-
18
-
19
-
20
-
 21
21 -
 22
22 -
 23
23 -
 24
24 -
 25
25 -
 26
26 -
 27
27 -
 28
28 -
 29
29 -
 30
30 -
 31
31 -
 32
32 -
 33
33 -
 34
34 -
 35
35 -
 36
36 -
 37
37 -
 38
38 -
 39
39 -
 40
40 -
 41
41 -
42
-
43
-
44
-
45
-
46
-
47
-
48
-
49
-
50
-
51
-
52
-
53
-
54
-
55
-
56
-
57
-
58
-
59
-
60
-
61
-
62
-
63
-
64
-
65
-
66
-
67
-
68
-
69
-
70
-
71
-
72
-
73
-
74
-
75
-
76
-
77
-
78
-
79
-
80
-
81
-
82
-
83
-
84
-
85
-
86
-
87
-
88
-
89
-
90
-
91
-
92
-
93
-
94
-
95
-
96
-
97
-
98
-
99
-
100
-
101
-
102
-
103
-
104
-
105
-
106
-
107
-
108
-
109
-
110
-
111
-
112
-
113
-
114
-
115
-
116
-
117
-
118
-
119
-
120
-
121
-
122
-
123
-
124
-
125
-
126
-
127
-
128
-
129
-
130
-
131
-
132
-
133
-
134
-
135
-
136
-
137
-
138
-
139
-
140
-
141
-
142
-
143
-
144
-
145
-
146
-
147
-
148
-
149
-
150
-
151
-
152
-
153
-
154
-
155
-
156
-
157
-
158
-
159
-
160
-
161
-
162
-
163
-
164
-
165
-
166
-
167
-
168
-
169
-
170
-
171
-
172
-
173
-
174
-
175
-
176
-
177
-
178
-
179
-
180
-
181
-
182
-
183
-
184
-
185
-
186
-
187
-
188
-
189
-
190
-
191
-
192
-
193
-
194
-
195
-
196
-
197
-
198
-
199
-
200
-
201
-
202
-
203
-
204
-
205
-
206
-
207
-
208
-
209
-
210
-
211
-
212
-
213
-
214
-
215
-
216
-
217
-
218
-
219
-
220
-
221
-
222
-
223
-
224
-
225
-
226
-
227
-
228
-
229
-
230
-
231
-
232
-
233
-
234
-
235
-
236
-
237
-
238
-
239
-
240
-
241
-
242
-
243
-
244
-
245
-
246
-
247
-
248
-
249
-
250
-
251
-
252
-
253
-
254
-
255
-
256
-
257
-
258
-
259
-
260
-
261
-
262
-
263
-
264
-
265
-
266
-
267
-
268
-
269
-
270
-
271
-
272
-
273
-
274
-
275
-
276
-
277
-
278
-
279
-
280
-
281
-
282
-
283
-
284
 |
 |
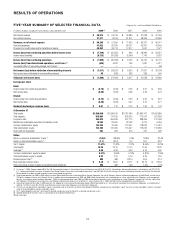
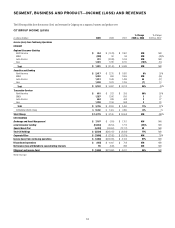
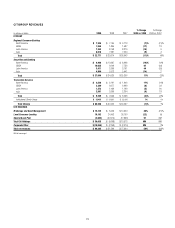
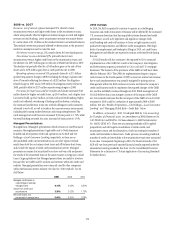
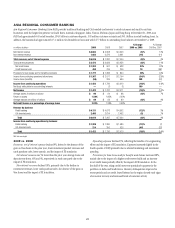
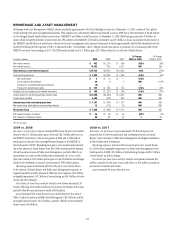
21
2008 vs. 2007
Revenues, net of interest expense increased 18% due to growth in the size
of the portfolio across Central and Eastern Europe and the Middle East.
Investment sales declined by 39% with assets under management declining
by 42% as a result of market conditions in the second half of 2008.
Net interest revenue was 31% higher than the prior year due to growth
in the size of the portfolio across Central and Eastern Europe and the Middle
East and growth in revolving balances. Average loans for retail banking were
up 26%, cards were up 49% and average deposits were up 22%.
Non-interest revenue decreased by 4% due to reduced investment revenue
as a result of market conditions.
Operating expenses increased 19%, reflecting growth in the portfolio and
repositioning charges.
Provisions for loan losses increased 49% to $312 million. Net credit
losses increased from $113 million to $237 million, while the Loan loss
reserve build decreased by 22% to $75 million. Credit costs increased as a
result of market conditions driving deterioration in the portfolio.
2010 Outlook
During 2010, EMEA RCB businesses are expected to operate in an
environment of continued challenging economic and credit conditions.
While key business drivers, including deposits, investment sales and card
purchase sales, began to show some signs of improvement during the
latter part of 2009, continued positive developments, if any, will depend
on the success of EMEA RCB’s strategy of concentrated focus on larger
urban markets. Credit quality is currently anticipated to improve modestly
with remedial programs and tighter origination standards reducing both
delinquencies and credit losses, with some continued pockets of weakness
in Poland and Hungary. Loan and card volume growth will continue to be
controlled, driven by tighter origination standards.