Citibank 2009 Annual Report Download - page 92
Download and view the complete annual report
Please find page 92 of the 2009 Citibank annual report below. You can navigate through the pages in the report by either clicking on the pages listed below, or by using the keyword search tool below to find specific information within the annual report.-
 1
1 -
2
-
3
-
4
-
5
-
6
-
7
-
8
-
9
-
10
-
11
-
12
-
13
-
14
-
15
-
16
-
17
-
18
-
19
-
20
-
21
-
22
-
23
-
24
-
25
-
26
-
27
-
28
-
29
-
30
-
31
-
32
-
33
-
34
-
35
-
36
-
37
-
38
-
39
-
40
-
41
-
42
-
43
-
44
-
45
-
46
-
47
-
48
-
49
-
50
-
51
-
52
-
53
-
54
-
55
-
56
-
57
-
58
-
59
-
60
-
61
-
62
-
63
-
64
-
65
-
66
-
67
-
68
-
69
-
70
-
71
-
72
-
73
-
74
-
75
-
76
-
77
-
78
-
79
-
80
-
81
-
 82
82 -
 83
83 -
 84
84 -
 85
85 -
 86
86 -
 87
87 -
 88
88 -
 89
89 -
 90
90 -
 91
91 -
 92
92 -
 93
93 -
 94
94 -
 95
95 -
 96
96 -
 97
97 -
 98
98 -
 99
99 -
 100
100 -
 101
101 -
 102
102 -
103
-
104
-
105
-
106
-
107
-
108
-
109
-
110
-
111
-
112
-
113
-
114
-
115
-
116
-
117
-
118
-
119
-
120
-
121
-
122
-
123
-
124
-
125
-
126
-
127
-
128
-
129
-
130
-
131
-
132
-
133
-
134
-
135
-
136
-
137
-
138
-
139
-
140
-
141
-
142
-
143
-
144
-
145
-
146
-
147
-
148
-
149
-
150
-
151
-
152
-
153
-
154
-
155
-
156
-
157
-
158
-
159
-
160
-
161
-
162
-
163
-
164
-
165
-
166
-
167
-
168
-
169
-
170
-
171
-
172
-
173
-
174
-
175
-
176
-
177
-
178
-
179
-
180
-
181
-
182
-
183
-
184
-
185
-
186
-
187
-
188
-
189
-
190
-
191
-
192
-
193
-
194
-
195
-
196
-
197
-
198
-
199
-
200
-
201
-
202
-
203
-
204
-
205
-
206
-
207
-
208
-
209
-
210
-
211
-
212
-
213
-
214
-
215
-
216
-
217
-
218
-
219
-
220
-
221
-
222
-
223
-
224
-
225
-
226
-
227
-
228
-
229
-
230
-
231
-
232
-
233
-
234
-
235
-
236
-
237
-
238
-
239
-
240
-
241
-
242
-
243
-
244
-
245
-
246
-
247
-
248
-
249
-
250
-
251
-
252
-
253
-
254
-
255
-
256
-
257
-
258
-
259
-
260
-
261
-
262
-
263
-
264
-
265
-
266
-
267
-
268
-
269
-
270
-
271
-
272
-
273
-
274
-
275
-
276
-
277
-
278
-
279
-
280
-
281
-
282
-
283
-
284
 |
 |

82
CORPORATE LOAN DETAILS
For corporate clients and investment banking activities across Citigroup, the
credit process is grounded in a series of fundamental policies, in addition
to those described under “Managing Global Risk—Risk Management—
Overview,” above. These include:
joint business and independent risk management responsibility for •
managing credit risks;
a single center of control for each credit relationship that coordinates •
credit activities with that client;
portfolio limits to ensure diversification and maintain risk/capital •
alignment;
a minimum of two authorized credit officer signatures required on •
extensions of credit, one of which must be from a credit officer in credit
risk management;
risk rating standards, applicable to every obligor and facility; and•
consistent standards for credit origination documentation and remedial •
management.
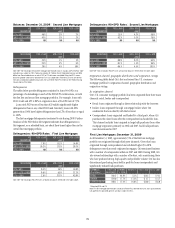
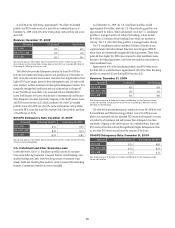
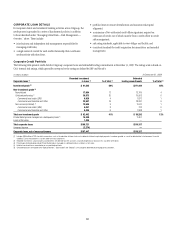
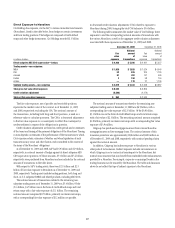
Corporate Credit Portfolio
The following table presents credit data for Citigroup’s corporate loans and unfunded lending commitments at December 31, 2009. The ratings scale is based on
Citi’s internal risk ratings, which generally correspond to the ratings as defined by S&P and Moody’s.
in millions of dollars At December 31, 2009
Corporate loans (1)
Recorded investment
in loans (2) % of total (3)
Unfunded
lending commitments % of total (3)
Investment grade (4) $ 91,565 59% $271,444 88%
Non-investment grade (4)
Noncriticized 17,984 12 13,769 4
Criticized performing (5) 30,873 20 19,953 6
Commercial real estate (CRE) 6,926 4 1,872 1
Commercial and Industrial and Other 23,947 16 18,081 6
Non-accrual (criticized) (5) 13,545 9 2,570 1
Commercial real estate (CRE) 4,051 3 732 0
Commercial and Industrial and Other 9,494 6 1,838 1
Total non-investment grade $ 62,402 41% $ 36,292 12%
Private Banking loans managed on a delinquency basis (4) 14,349 2,451
Loans at fair value 1,405 —
Total corporate loans $169,721 $310,187
Unearned income (2,274) —
Corporate loans, net of unearned income $167,447 $310,187
(1) Includes $955 million of TDRs for which concessions, such as the reduction of interest rates or the deferral of interest or principal payments, have been granted as a result of deterioration in the borrowers’ financial
condition. Each of the borrowers is current under the restructured terms.
(2) Recorded investment in a loan includes accrued interest, net deferred loan fees and costs, unamortized premium or discount, less any direct write-downs.
(3) Percentages disclosed above exclude Private Banking loans managed on a delinquency basis and loans at fair value.
(4) Held-for-investment loans accounted for on an amortized cost basis.
(5) Criticized exposures correspond to the “Special Mention,” “Substandard” and “Doubtful” asset categories defined by banking regulatory authorities.