Citibank 2009 Annual Report Download - page 49
Download and view the complete annual report
Please find page 49 of the 2009 Citibank annual report below. You can navigate through the pages in the report by either clicking on the pages listed below, or by using the keyword search tool below to find specific information within the annual report.-
 1
1 -
2
-
3
-
4
-
5
-
6
-
7
-
8
-
9
-
10
-
11
-
12
-
13
-
14
-
15
-
16
-
17
-
18
-
19
-
20
-
21
-
22
-
23
-
24
-
25
-
26
-
27
-
28
-
29
-
30
-
31
-
32
-
33
-
34
-
35
-
36
-
37
-
38
-
 39
39 -
 40
40 -
 41
41 -
 42
42 -
 43
43 -
 44
44 -
 45
45 -
 46
46 -
 47
47 -
 48
48 -
 49
49 -
 50
50 -
 51
51 -
 52
52 -
 53
53 -
 54
54 -
 55
55 -
 56
56 -
 57
57 -
 58
58 -
 59
59 -
60
-
61
-
62
-
63
-
64
-
65
-
66
-
67
-
68
-
69
-
70
-
71
-
72
-
73
-
74
-
75
-
76
-
77
-
78
-
79
-
80
-
81
-
82
-
83
-
84
-
85
-
86
-
87
-
88
-
89
-
90
-
91
-
92
-
93
-
94
-
95
-
96
-
97
-
98
-
99
-
100
-
101
-
102
-
103
-
104
-
105
-
106
-
107
-
108
-
109
-
110
-
111
-
112
-
113
-
114
-
115
-
116
-
117
-
118
-
119
-
120
-
121
-
122
-
123
-
124
-
125
-
126
-
127
-
128
-
129
-
130
-
131
-
132
-
133
-
134
-
135
-
136
-
137
-
138
-
139
-
140
-
141
-
142
-
143
-
144
-
145
-
146
-
147
-
148
-
149
-
150
-
151
-
152
-
153
-
154
-
155
-
156
-
157
-
158
-
159
-
160
-
161
-
162
-
163
-
164
-
165
-
166
-
167
-
168
-
169
-
170
-
171
-
172
-
173
-
174
-
175
-
176
-
177
-
178
-
179
-
180
-
181
-
182
-
183
-
184
-
185
-
186
-
187
-
188
-
189
-
190
-
191
-
192
-
193
-
194
-
195
-
196
-
197
-
198
-
199
-
200
-
201
-
202
-
203
-
204
-
205
-
206
-
207
-
208
-
209
-
210
-
211
-
212
-
213
-
214
-
215
-
216
-
217
-
218
-
219
-
220
-
221
-
222
-
223
-
224
-
225
-
226
-
227
-
228
-
229
-
230
-
231
-
232
-
233
-
234
-
235
-
236
-
237
-
238
-
239
-
240
-
241
-
242
-
243
-
244
-
245
-
246
-
247
-
248
-
249
-
250
-
251
-
252
-
253
-
254
-
255
-
256
-
257
-
258
-
259
-
260
-
261
-
262
-
263
-
264
-
265
-
266
-
267
-
268
-
269
-
270
-
271
-
272
-
273
-
274
-
275
-
276
-
277
-
278
-
279
-
280
-
281
-
282
-
283
-
284
 |
 |

39
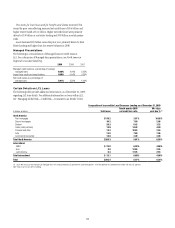
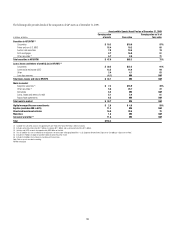
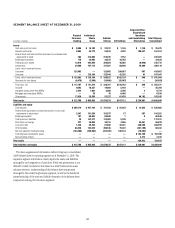
BALANCE SHEET REVIEW
In billions of dollars
December 31, Increase
(decrease)
%
Change2009 2008
Assets
Loans, net of unearned income and allowance for loan losses $ 555 $ 665 $(110) (17)%
Trading account assets 343 378 (35) (9)
Federal funds sold and securities borrowed or purchased under agreements to resell 222 184 38 21
Investments 306 256 50 20
Other assets 431 455 (24) (5)
Total assets $1,857 $1,938 $ (81) (4)%
Liabilities
Deposits $ 836 $ 774 $ 62 8%
Federal funds purchased and securities loaned or sold under agreements to repurchase 154 205 (51) (25)
Short-term borrowings and long-term debt 433 486 (53) (11)
Trading account liabilities 138 166 (28) (17)
Other liabilities 141 163 (22) (13)
Total liabilities $1,702 $1,794 $ (92) (5)%
Stockholders’ equity $ 155 $ 144 $ 11 8%
Total liabilities and stockholders’ equity $1,857 $1,938 $ (81) (4)%
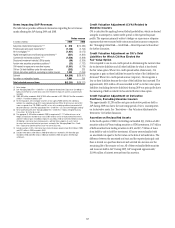
Loans
Loans are an extension of credit to individuals, corporations, or government
institutions. Loans vary across regions and industries and primarily include
credit cards, mortgages, other real estate lending, personal loans, auto loans,
student loans, and corporate loans. The majority of loans are carried at cost
with a minimal amount recorded at fair value.
Consumer and corporate loans comprised 72% and 28%, respectively, of
Citi’s total loans (net of unearned income and before the allowance for loan
losses) as of December 31, 2009.
During 2009, consumer loans (net of allowance for loan losses) decreased
by $64 billion, or 14%, primarily due to a:
$33 billion, or 12%, decrease in mortgage and real estate loans; and•
$17 billion, or 19%, decrease in credit card loans, mostly in the U.S.•
These decreases were driven by tightened lending standards and credit
activity during the year.
During 2009, corporate loans decreased $46 billion, or 22%, primarily
driven by a decrease of $21 billion, or 20%, in commercial and industrial
loans.
During 2009, average consumer loans (net of unearned income) of
$456 billion yielded an average rate of 7.8%, compared to $513 billion and
8.9% in the prior year. Average corporate loans of $190 billion yielded an
average rate of 6.3% in 2009, compared to $221 billion and 7.7% in the
prior year.
For further information, see “Loans Outstanding” under “Managing Global
Risk—Credit Risk” and Note 17 to the Consolidated Financial Statements.
Trading Account Assets (Liabilities)
Trading account assets include debt and marketable equity securities,
derivatives in a receivable position, residual interests in securitizations, and
physical commodities inventory. In addition, certain assets that Citigroup has
elected to carry at fair value, such as certain loans and purchase guarantees,
are also included in Trading account assets. Trading account liabilities
include securities sold, not yet purchased (short positions) and derivatives in
a net payable position as well as certain liabilities that Citigroup has elected
to carry at fair value.
All Trading account assets and Trading account liabilities are reported
at their fair value, except for physical commodities inventory which is carried
at the lower of cost or market, with unrealized gains and losses recognized in
current income.
During 2009, Trading account assets decreased by $35 billion, or 9%,
due to a:
$56 billion, or 49%, decrease in revaluation gains primarily consisting •
of decreases in interest rate and foreign exchange contracts as well as a
decrease in netting agreements;
$16 billion, or 30%, decrease in mortgage loan securities driven by •
decreased agency and subprime debt;
$20 billion, or 172%, increase in U.S. Treasury and federal agency securities;•
$15 billion, or 27%, increase in foreign government securities; and•
$7 billion, or 9%, increase in corporate and other debt securities.•