Citibank 2009 Annual Report Download - page 204
Download and view the complete annual report
Please find page 204 of the 2009 Citibank annual report below. You can navigate through the pages in the report by either clicking on the pages listed below, or by using the keyword search tool below to find specific information within the annual report.-
 1
1 -
2
-
3
-
4
-
5
-
6
-
7
-
8
-
9
-
10
-
11
-
12
-
13
-
14
-
15
-
16
-
17
-
18
-
19
-
20
-
21
-
22
-
23
-
24
-
25
-
26
-
27
-
28
-
29
-
30
-
31
-
32
-
33
-
34
-
35
-
36
-
37
-
38
-
39
-
40
-
41
-
42
-
43
-
44
-
45
-
46
-
47
-
48
-
49
-
50
-
51
-
52
-
53
-
54
-
55
-
56
-
57
-
58
-
59
-
60
-
61
-
62
-
63
-
64
-
65
-
66
-
67
-
68
-
69
-
70
-
71
-
72
-
73
-
74
-
75
-
76
-
77
-
78
-
79
-
80
-
81
-
82
-
83
-
84
-
85
-
86
-
87
-
88
-
89
-
90
-
91
-
92
-
93
-
94
-
95
-
96
-
97
-
98
-
99
-
100
-
101
-
102
-
103
-
104
-
105
-
106
-
107
-
108
-
109
-
110
-
111
-
112
-
113
-
114
-
115
-
116
-
117
-
118
-
119
-
120
-
121
-
122
-
123
-
124
-
125
-
126
-
127
-
128
-
129
-
130
-
131
-
132
-
133
-
134
-
135
-
136
-
137
-
138
-
139
-
140
-
141
-
142
-
143
-
144
-
145
-
146
-
147
-
148
-
149
-
150
-
151
-
152
-
153
-
154
-
155
-
156
-
157
-
158
-
159
-
160
-
161
-
162
-
163
-
164
-
165
-
166
-
167
-
168
-
169
-
170
-
171
-
172
-
173
-
174
-
175
-
176
-
177
-
178
-
179
-
180
-
181
-
182
-
183
-
184
-
185
-
186
-
187
-
188
-
189
-
190
-
191
-
192
-
193
-
 194
194 -
 195
195 -
 196
196 -
 197
197 -
 198
198 -
 199
199 -
 200
200 -
 201
201 -
 202
202 -
 203
203 -
 204
204 -
 205
205 -
 206
206 -
 207
207 -
 208
208 -
 209
209 -
 210
210 -
 211
211 -
 212
212 -
 213
213 -
 214
214 -
215
-
216
-
217
-
218
-
219
-
220
-
221
-
222
-
223
-
224
-
225
-
226
-
227
-
228
-
229
-
230
-
231
-
232
-
233
-
234
-
235
-
236
-
237
-
238
-
239
-
240
-
241
-
242
-
243
-
244
-
245
-
246
-
247
-
248
-
249
-
250
-
251
-
252
-
253
-
254
-
255
-
256
-
257
-
258
-
259
-
260
-
261
-
262
-
263
-
264
-
265
-
266
-
267
-
268
-
269
-
270
-
271
-
272
-
273
-
274
-
275
-
276
-
277
-
278
-
279
-
280
-
281
-
282
-
283
-
284
 |
 |

194
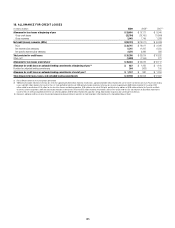
22. CHANGES IN ACCUMULATED OTHER COMPREHENSIVE INCOME (LOSS)
Changes in each component of “Accumulated Other Comprehensive Income (Loss)” for the three-year period ended December 31, 2009 are as follows:
In millions of dollars
Net unrealized
gains (losses)
on investment
securities
Foreign
currency
translation
adjustment,
net of
hedges
Cash flow
hedges
Pension
liability
adjustments
Accumulated
other
comprehensive
income (loss)
Balance, January 1, 2007 $ 1,092 $ (2,796 ) $ (61 ) $(1,786 ) $ (3,551 )
Change in net unrealized gains (losses) on investment securities, net of taxes 138 — — — 138
Less: Reclassification adjustment for net gains included in net income, net of taxes (759 ) — — — (759 )
Foreign currency translation adjustment, net of taxes (1) — 2,024 — — 2,024
Cash flow hedges, net of taxes (2) — — (3,102 ) — (3,102 )
Pension liability adjustment, net of taxes (3) — — — 590 590
Change $ (621 ) $ 2,024 $(3,102 ) $ 590 $ (1,109 )
Balance, December 31, 2007 $ 471 $ (772 ) $(3,163 ) $(1,196 ) $ (4,660 )
Change in net unrealized gains (losses) on investment securities, net of taxes (11,422 ) — — — (11,422 )
Less: Reclassification adjustment for net losses included in net income, net of taxes 1,304 — — — 1,304
Foreign currency translation adjustment, net of taxes (1) — (6,972 ) — — (6,972 )
Cash flow hedges, net of taxes (2) — — (2,026 ) — (2,026 )
Pension liability adjustment, net of taxes (3) — — — (1,419 ) (1,419 )
Change $ (10,118 ) $ (6,972 ) $ (2,026 ) $(1,419 ) $ (20,535 )
Balance, December 31, 2008 $ (9,647 ) $ (7,744 ) $(5,189 ) $(2,615 ) $(25,195 )
Cumulative effect of accounting change (ASC 320-10-35/FSP FAS 115-2
and FAS 124-2) (413) — — — (413)
Balance, January 1, 2009 $(10,060) $ (7,744) $(5,189) $(2,615) $(25,608)
Change in net unrealized gains (losses) on investment securities, net of taxes 5,268 — — — 5,268
Less: Reclassification adjustment for net losses included in net income, net of taxes 445 — — — 445
Foreign currency translation adjustment, net of taxes (1) — (203) — — (203)
Cash flow hedges, net of taxes (2) — — 2,007 — 2,007
Pension liability adjustment, net of taxes (3) — — — (846) (846)
Change $ 5,713 $ (203 ) $ 2,007 $ (846) $ 6,671
Balance, December 31, 2009 (4) $ (4,347) $ (7,947 ) $(3,182) $(3,461) $(18,937)
(1) Reflects, among other items: the movements in the British pound, Euro, Japanese yen, Korean won, Polish zloty and Mexican peso against the U.S. dollar, and changes in related tax effects and hedges.
(2) Primarily driven by Citigroup’s pay fixed/receive floating interest rate swap programs that are hedging the floating rates on deposits and long-term debt.
(3) Reflects adjustments to the funded status of pension and postretirement plans, which is the difference between the fair value of the plan assets and the projected benefit obligation.
(4) The December 31, 2009 balance of $(4.3) billion for net unrealized losses on investment securities consists of $(4.7) billion for those investments classified as held-to-maturity and $0.4 billion for those classified as
available-for-sale.