Citibank 2009 Annual Report Download - page 238
Download and view the complete annual report
Please find page 238 of the 2009 Citibank annual report below. You can navigate through the pages in the report by either clicking on the pages listed below, or by using the keyword search tool below to find specific information within the annual report.-
 1
1 -
2
-
3
-
4
-
5
-
6
-
7
-
8
-
9
-
10
-
11
-
12
-
13
-
14
-
15
-
16
-
17
-
18
-
19
-
20
-
21
-
22
-
23
-
24
-
25
-
26
-
27
-
28
-
29
-
30
-
31
-
32
-
33
-
34
-
35
-
36
-
37
-
38
-
39
-
40
-
41
-
42
-
43
-
44
-
45
-
46
-
47
-
48
-
49
-
50
-
51
-
52
-
53
-
54
-
55
-
56
-
57
-
58
-
59
-
60
-
61
-
62
-
63
-
64
-
65
-
66
-
67
-
68
-
69
-
70
-
71
-
72
-
73
-
74
-
75
-
76
-
77
-
78
-
79
-
80
-
81
-
82
-
83
-
84
-
85
-
86
-
87
-
88
-
89
-
90
-
91
-
92
-
93
-
94
-
95
-
96
-
97
-
98
-
99
-
100
-
101
-
102
-
103
-
104
-
105
-
106
-
107
-
108
-
109
-
110
-
111
-
112
-
113
-
114
-
115
-
116
-
117
-
118
-
119
-
120
-
121
-
122
-
123
-
124
-
125
-
126
-
127
-
128
-
129
-
130
-
131
-
132
-
133
-
134
-
135
-
136
-
137
-
138
-
139
-
140
-
141
-
142
-
143
-
144
-
145
-
146
-
147
-
148
-
149
-
150
-
151
-
152
-
153
-
154
-
155
-
156
-
157
-
158
-
159
-
160
-
161
-
162
-
163
-
164
-
165
-
166
-
167
-
168
-
169
-
170
-
171
-
172
-
173
-
174
-
175
-
176
-
177
-
178
-
179
-
180
-
181
-
182
-
183
-
184
-
185
-
186
-
187
-
188
-
189
-
190
-
191
-
192
-
193
-
194
-
195
-
196
-
197
-
198
-
199
-
200
-
201
-
202
-
203
-
204
-
205
-
206
-
207
-
208
-
209
-
210
-
211
-
212
-
213
-
214
-
215
-
216
-
217
-
218
-
219
-
220
-
221
-
222
-
223
-
224
-
225
-
226
-
227
-
 228
228 -
 229
229 -
 230
230 -
 231
231 -
 232
232 -
 233
233 -
 234
234 -
 235
235 -
 236
236 -
 237
237 -
 238
238 -
 239
239 -
 240
240 -
 241
241 -
 242
242 -
 243
243 -
 244
244 -
 245
245 -
 246
246 -
 247
247 -
 248
248 -
249
-
250
-
251
-
252
-
253
-
254
-
255
-
256
-
257
-
258
-
259
-
260
-
261
-
262
-
263
-
264
-
265
-
266
-
267
-
268
-
269
-
270
-
271
-
272
-
273
-
274
-
275
-
276
-
277
-
278
-
279
-
280
-
281
-
282
-
283
-
284
 |
 |

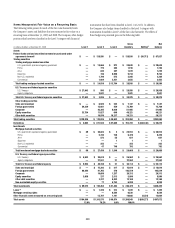
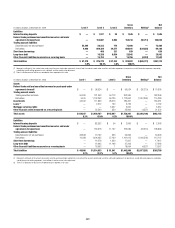
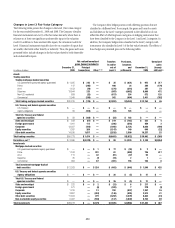
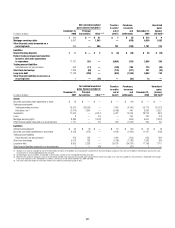
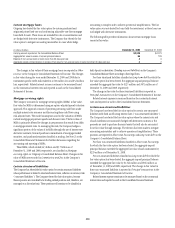
228
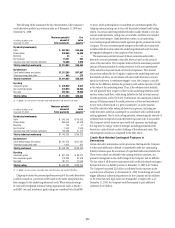
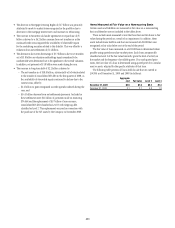
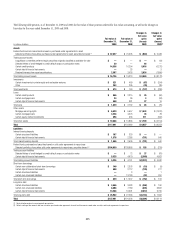
Items Measured at Fair Value on a Recurring Basis
The following tables present for each of the fair value hierarchy levels
the Company’s assets and liabilities that are measured at fair value on a
recurring basis at December 31, 2009 and 2008. The Company often hedges
positions that have been classified in the Level 3 category with financial
instruments that have been classified as Level 1 or Level 2. In addition,
the Company also hedges items classified in the Level 3 category with
instruments classified in Level 3 of the fair value hierarchy. The effects of
these hedges are presented gross in the following table.
In millions of dollars at December 31, 2009 Level 1 Level 2 Level 3
Gross
inventory Netting(1)
Net
balance
Assets
Federal funds sold and securities borrowed or purchased under
agreements to resell $ — $ 138,550 $ — $ 138,550 $ (50,713) $ 87,837
Trading securities
Trading mortgage-backed securities
U.S. government-sponsored agency guaranteed $ — $ 19,666 $ 972 $ 20,638 $ — $ 20,638
Prime — 772 384 1,156 — 1,156
Alt-A — 842 387 1,229 — 1,229
Subprime — 736 8,998 9,734 — 9,734
Non-U.S. residential — 1,796 572 2,368 — 2,368
Commercial — 1,004 2,451 3,455 — 3,455
Total trading mortgage-backed securities $ — $ 24,816 $ 13,764 $ 38,580 $ — $ 38,580
U.S. Treasury and federal agencies securities
U.S. Treasury $ 27,943 $ 995 $ — $ 28,938 $ — $ 28,938
Agency obligations — 2,041 — 2,041 — 2,041
Total U.S. Treasury and federal agencies securities $ 27,943 $ 3,036 $ — $ 30,979 $ — $ 30,979
Other trading securities
State and municipal $ — $ 6,925 $ 222 $ 7,147 $ — $ 7,147
Foreign government 59,229 13,081 459 72,769 — 72,769
Corporate — 43,365 8,620 51,985 — 51,985
Equity securities 33,754 11,827 640 46,221 — 46,221
Other debt securities — 19,976 16,237 36,213 — 36,213
Total trading securities $120,926 $ 123,026 $ 39,942 $ 283,894 $ — $283,894
Derivatives $ 4,002 $ 671,532 $ 27,685 $ 703,219 $(644,340) $ 58,879
Investments
Mortgage-backed securities
U.S. government-sponsored agency guaranteed $ 89 $ 20,823 $ 2 $ 20,914 $ — $ 20,914
Prime — 5,742 736 6,478 — 6,478
Alt-A — 572 55 627 — 627
Subprime — — 1 1 — 1
Non-U.S. residential — 255 — 255 — 255
Commercial — 47 746 793 — 793
Total investment mortgage-backed securities $ 89 $ 27,439 $ 1,540 $ 29,068 $ — $ 29,068
U.S. Treasury and federal agency securities
U.S. Treasury $ 5,943 $ 20,619 $ — $ 26,562 $ — $ 26,562
Agency obligations — 27,531 21 27,552 — 27,552
Total U.S. Treasury and federal agency $ 5,943 $ 48,150 $ 21 $ 54,114 $ — $ 54,114
State and municipal $ — $ 15,393 $ 217 $ 15,610 $ — $ 15,610
Foreign government 60,484 41,765 270 102,519 — 102,519
Corporate — 19,056 1,257 20,313 — 20,313
Equity securities 3,056 237 2,513 5,806 — 5,806
Other debt securities — 3,337 8,832 12,169 — 12,169
Non-marketable equity securities — 77 6,753 6,830 — 6,830
Total investments $ 69,572 $ 155,454 $ 21,403 $ 246,429 $ — $246,429
Loans (2) $ — $ 1,226 $ 213 $ 1,439 $ — $ 1,439
Mortgage servicing rights — — 6,530 6,530 — 6,530
Other financial assets measured on a recurring basis — 15,787 1,101 16,888 (4,224) 12,664
Total assets $194,500 $1,105,575 $ 96,874 $1,396,949 $(699,277) $697,672
13.9% 79.2% 6.9% 100.0%