Citibank 2009 Annual Report Download - page 25
Download and view the complete annual report
Please find page 25 of the 2009 Citibank annual report below. You can navigate through the pages in the report by either clicking on the pages listed below, or by using the keyword search tool below to find specific information within the annual report.-
 1
1 -
2
-
3
-
4
-
5
-
6
-
7
-
8
-
9
-
10
-
11
-
12
-
13
-
14
-
 15
15 -
 16
16 -
 17
17 -
 18
18 -
 19
19 -
 20
20 -
 21
21 -
 22
22 -
 23
23 -
 24
24 -
 25
25 -
 26
26 -
 27
27 -
 28
28 -
 29
29 -
 30
30 -
 31
31 -
 32
32 -
 33
33 -
 34
34 -
 35
35 -
36
-
37
-
38
-
39
-
40
-
41
-
42
-
43
-
44
-
45
-
46
-
47
-
48
-
49
-
50
-
51
-
52
-
53
-
54
-
55
-
56
-
57
-
58
-
59
-
60
-
61
-
62
-
63
-
64
-
65
-
66
-
67
-
68
-
69
-
70
-
71
-
72
-
73
-
74
-
75
-
76
-
77
-
78
-
79
-
80
-
81
-
82
-
83
-
84
-
85
-
86
-
87
-
88
-
89
-
90
-
91
-
92
-
93
-
94
-
95
-
96
-
97
-
98
-
99
-
100
-
101
-
102
-
103
-
104
-
105
-
106
-
107
-
108
-
109
-
110
-
111
-
112
-
113
-
114
-
115
-
116
-
117
-
118
-
119
-
120
-
121
-
122
-
123
-
124
-
125
-
126
-
127
-
128
-
129
-
130
-
131
-
132
-
133
-
134
-
135
-
136
-
137
-
138
-
139
-
140
-
141
-
142
-
143
-
144
-
145
-
146
-
147
-
148
-
149
-
150
-
151
-
152
-
153
-
154
-
155
-
156
-
157
-
158
-
159
-
160
-
161
-
162
-
163
-
164
-
165
-
166
-
167
-
168
-
169
-
170
-
171
-
172
-
173
-
174
-
175
-
176
-
177
-
178
-
179
-
180
-
181
-
182
-
183
-
184
-
185
-
186
-
187
-
188
-
189
-
190
-
191
-
192
-
193
-
194
-
195
-
196
-
197
-
198
-
199
-
200
-
201
-
202
-
203
-
204
-
205
-
206
-
207
-
208
-
209
-
210
-
211
-
212
-
213
-
214
-
215
-
216
-
217
-
218
-
219
-
220
-
221
-
222
-
223
-
224
-
225
-
226
-
227
-
228
-
229
-
230
-
231
-
232
-
233
-
234
-
235
-
236
-
237
-
238
-
239
-
240
-
241
-
242
-
243
-
244
-
245
-
246
-
247
-
248
-
249
-
250
-
251
-
252
-
253
-
254
-
255
-
256
-
257
-
258
-
259
-
260
-
261
-
262
-
263
-
264
-
265
-
266
-
267
-
268
-
269
-
270
-
271
-
272
-
273
-
274
-
275
-
276
-
277
-
278
-
279
-
280
-
281
-
282
-
283
-
284
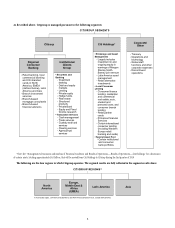
 |
 |

15
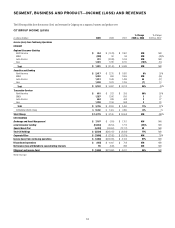
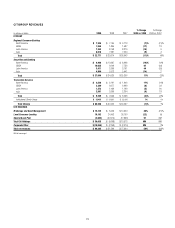
CITIGROUP REVENUES
In millions of dollars 2009 2008 2007
% Change
2009 vs. 2008
% Change
2008 vs. 2007
CITICORP
Regional Consumer Banking
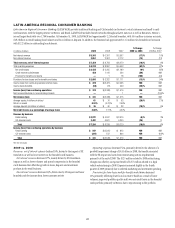
North America $ 7,246 $ 7,764 $ 9,773 (7)% (21)%
EMEA 1,555 1,865 1,587 (17) 18
Latin America 7,354 8,758 8,279 (16) 6
Asia 6,616 7,287 7,004 (9) 4
Total $ 22,771 $ 25,674 $ 26,643 (11)% (4)%
Securities and Banking
North America $ 9,400 $ 10,987 $ 8,998 (14)% 22%
EMEA 10,035 6,006 7,756 67 (23)
Latin America 3,411 2,369 3,161 44 (25)
Asia 4,800 5,573 5,441 (14) 2
Total $ 27,646 $ 24,935 $ 25,356 11% (2)%
Transaction Services
North America $ 2,526 $ 2,161 $ 1,646 17% 31%
EMEA 3,389 3,677 2,999 (8) 23
Latin America 1,373 1,439 1,199 (5) 20
Asia 2,501 2,669 2,254 (6) 18
Total $ 9,789 $ 9,946 $ 8,098 (2)% 23%
Institutional Clients Group $ 37,435 $ 34,881 $ 33,454 7% 4%
Total Citicorp $ 60,206 $ 60,555 $ 60,097 (1)% 1%
CITI HOLDINGS
Brokerage and Asset Management $ 15,135 $ 8,423 $ 10,659 80% (21)%
Local Consumer Lending 19,182 24,453 26,750 (22) (9)
Special Asset Pool (3,682) (39,574) (17,896) 91 NM
Total Citi Holdings $ 30,635 $ (6,698) $ 19,513 NM NM
Corporate/Other $(10,556) $ (2,258) $ (2,310) NM 2%
Total net revenues $ 80,285 $ 51,599 $ 77,300 56% (33)%
NM Not meaningful