Citibank 2009 Annual Report Download - page 93
Download and view the complete annual report
Please find page 93 of the 2009 Citibank annual report below. You can navigate through the pages in the report by either clicking on the pages listed below, or by using the keyword search tool below to find specific information within the annual report.-
 1
1 -
2
-
3
-
4
-
5
-
6
-
7
-
8
-
9
-
10
-
11
-
12
-
13
-
14
-
15
-
16
-
17
-
18
-
19
-
20
-
21
-
22
-
23
-
24
-
25
-
26
-
27
-
28
-
29
-
30
-
31
-
32
-
33
-
34
-
35
-
36
-
37
-
38
-
39
-
40
-
41
-
42
-
43
-
44
-
45
-
46
-
47
-
48
-
49
-
50
-
51
-
52
-
53
-
54
-
55
-
56
-
57
-
58
-
59
-
60
-
61
-
62
-
63
-
64
-
65
-
66
-
67
-
68
-
69
-
70
-
71
-
72
-
73
-
74
-
75
-
76
-
77
-
78
-
79
-
80
-
81
-
82
-
 83
83 -
 84
84 -
 85
85 -
 86
86 -
 87
87 -
 88
88 -
 89
89 -
 90
90 -
 91
91 -
 92
92 -
 93
93 -
 94
94 -
 95
95 -
 96
96 -
 97
97 -
 98
98 -
 99
99 -
 100
100 -
 101
101 -
 102
102 -
 103
103 -
104
-
105
-
106
-
107
-
108
-
109
-
110
-
111
-
112
-
113
-
114
-
115
-
116
-
117
-
118
-
119
-
120
-
121
-
122
-
123
-
124
-
125
-
126
-
127
-
128
-
129
-
130
-
131
-
132
-
133
-
134
-
135
-
136
-
137
-
138
-
139
-
140
-
141
-
142
-
143
-
144
-
145
-
146
-
147
-
148
-
149
-
150
-
151
-
152
-
153
-
154
-
155
-
156
-
157
-
158
-
159
-
160
-
161
-
162
-
163
-
164
-
165
-
166
-
167
-
168
-
169
-
170
-
171
-
172
-
173
-
174
-
175
-
176
-
177
-
178
-
179
-
180
-
181
-
182
-
183
-
184
-
185
-
186
-
187
-
188
-
189
-
190
-
191
-
192
-
193
-
194
-
195
-
196
-
197
-
198
-
199
-
200
-
201
-
202
-
203
-
204
-
205
-
206
-
207
-
208
-
209
-
210
-
211
-
212
-
213
-
214
-
215
-
216
-
217
-
218
-
219
-
220
-
221
-
222
-
223
-
224
-
225
-
226
-
227
-
228
-
229
-
230
-
231
-
232
-
233
-
234
-
235
-
236
-
237
-
238
-
239
-
240
-
241
-
242
-
243
-
244
-
245
-
246
-
247
-
248
-
249
-
250
-
251
-
252
-
253
-
254
-
255
-
256
-
257
-
258
-
259
-
260
-
261
-
262
-
263
-
264
-
265
-
266
-
267
-
268
-
269
-
270
-
271
-
272
-
273
-
274
-
275
-
276
-
277
-
278
-
279
-
280
-
281
-
282
-
283
-
284
 |
 |

83
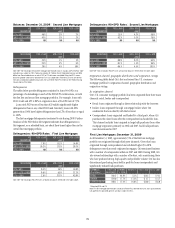
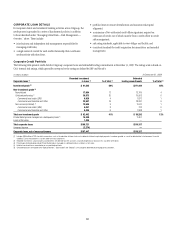
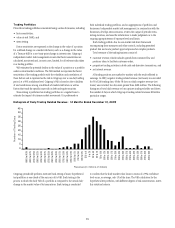
The following tables represent the corporate credit portfolio (excluding
Private Banking), before consideration of collateral, by maturity at
December 31, 2009. The corporate portfolio is broken out by direct
outstandings that include drawn loans, overdrafts, interbank placements,
bankers’ acceptances, certain investment securities and leases and unfunded
commitments that include unused commitments to lend, letters of credit and
financial guarantees.
At December 31, 2009
In billions of dollars
Due
within
1 year
Greater
than 1 year
but within
5 years
Greater
than
5 years
Total
exposure
Direct outstandings $213 $ 66 $ 7 $286
Unfunded lending commitments 182 120 10 312
Total $395 $186 $17 $598
At December 31, 2008
In billions of dollars
Due
within
1 year
Greater
than 1 year
but within
5 years
Greater
than
5 years
Total
exposure
Direct outstandings $161 $100 $ 9 $270
Unfunded lending commitments 206 141 12 359
Total $367 $241 $21 $629
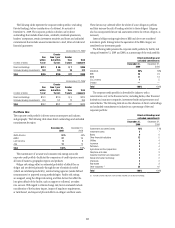
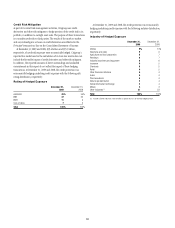
Portfolio Mix
The corporate credit portfolio is diverse across counterparty and industry,
and geography. The following table shows direct outstandings and unfunded
commitments by region:
December 31,
2009
December 31,
2008
North America 51% 49%
EMEA 27 29
Latin America 98
Asia 13 14
Total 100% 100%
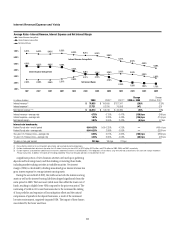
The maintenance of accurate and consistent risk ratings across the
corporate credit portfolio facilitates the comparison of credit exposure across
all lines of business, geographic regions and products.
Obligor risk ratings reflect an estimated probability of default for an
obligor and are derived primarily through the use of statistical models
(which are validated periodically), external rating agencies (under defined
circumstances) or approved scoring methodologies. Facility risk ratings
are assigned, using the obligor risk rating, and then factors that affect the
loss-given default of the facility, such as support or collateral, are taken
into account. With regard to climate change risk, factors evaluated include
consideration of the business impact, impact of regulatory requirements,
or lack thereof, and impact of physical effects on obligors and their assets.
These factors may adversely affect the ability of some obligors to perform
and thus increase the risk of lending activities to these obligors. Citigroup
also has incorporated climate risk assessment criteria for certain obligors, as
necessary.
Internal obligor ratings equivalent to BBB and above are considered
investment grade. Ratings below the equivalent of the BBB category are
considered non-investment grade.
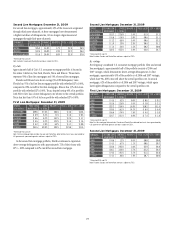
The following table presents the corporate credit portfolio by facility risk
rating at December 31, 2009 and 2008, as a percentage of the total portfolio:
Direct outstandings and
unfunded commitments
December 31,
2009
December 31,
2008
AAA/AA/A 58% 58%
BBB 24 24
BB/B 11 13
CCC or below 75
Unrated ——
Total 100% 100%
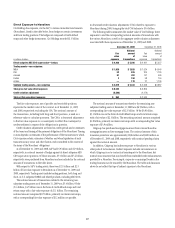
The corporate credit portfolio is diversified by industry, with a
concentration only in the financial sector, including banks, other financial
institutions, insurance companies, investment banks and government and
central banks. The following table shows the allocation of direct outstandings
and unfunded commitments to industries as a percentage of the total
corporate portfolio:
Direct outstandings and
unfunded commitments
December 31,
2009
December 31,
2008
Government and central banks 12% 11%
Investment banks 57
Banks 96
Other financial institutions 12 5
Utilities 44
Insurance 44
Petroleum 44
Agriculture and food preparation 44
Telephone and cable 33
Industrial machinery and equipment 23
Global information technology 22
Chemicals 22
Real estate 33
Other industries (1) 34 42
Total 100% 100%
(1) Includes all other industries, none of which exceeds 2% of total outstandings.