Citibank 2009 Annual Report Download - page 104
Download and view the complete annual report
Please find page 104 of the 2009 Citibank annual report below. You can navigate through the pages in the report by either clicking on the pages listed below, or by using the keyword search tool below to find specific information within the annual report.-
 1
1 -
2
-
3
-
4
-
5
-
6
-
7
-
8
-
9
-
10
-
11
-
12
-
13
-
14
-
15
-
16
-
17
-
18
-
19
-
20
-
21
-
22
-
23
-
24
-
25
-
26
-
27
-
28
-
29
-
30
-
31
-
32
-
33
-
34
-
35
-
36
-
37
-
38
-
39
-
40
-
41
-
42
-
43
-
44
-
45
-
46
-
47
-
48
-
49
-
50
-
51
-
52
-
53
-
54
-
55
-
56
-
57
-
58
-
59
-
60
-
61
-
62
-
63
-
64
-
65
-
66
-
67
-
68
-
69
-
70
-
71
-
72
-
73
-
74
-
75
-
76
-
77
-
78
-
79
-
80
-
81
-
82
-
83
-
84
-
85
-
86
-
87
-
88
-
89
-
90
-
91
-
92
-
93
-
 94
94 -
 95
95 -
 96
96 -
 97
97 -
 98
98 -
 99
99 -
 100
100 -
 101
101 -
 102
102 -
 103
103 -
 104
104 -
 105
105 -
 106
106 -
 107
107 -
 108
108 -
 109
109 -
 110
110 -
 111
111 -
 112
112 -
 113
113 -
 114
114 -
115
-
116
-
117
-
118
-
119
-
120
-
121
-
122
-
123
-
124
-
125
-
126
-
127
-
128
-
129
-
130
-
131
-
132
-
133
-
134
-
135
-
136
-
137
-
138
-
139
-
140
-
141
-
142
-
143
-
144
-
145
-
146
-
147
-
148
-
149
-
150
-
151
-
152
-
153
-
154
-
155
-
156
-
157
-
158
-
159
-
160
-
161
-
162
-
163
-
164
-
165
-
166
-
167
-
168
-
169
-
170
-
171
-
172
-
173
-
174
-
175
-
176
-
177
-
178
-
179
-
180
-
181
-
182
-
183
-
184
-
185
-
186
-
187
-
188
-
189
-
190
-
191
-
192
-
193
-
194
-
195
-
196
-
197
-
198
-
199
-
200
-
201
-
202
-
203
-
204
-
205
-
206
-
207
-
208
-
209
-
210
-
211
-
212
-
213
-
214
-
215
-
216
-
217
-
218
-
219
-
220
-
221
-
222
-
223
-
224
-
225
-
226
-
227
-
228
-
229
-
230
-
231
-
232
-
233
-
234
-
235
-
236
-
237
-
238
-
239
-
240
-
241
-
242
-
243
-
244
-
245
-
246
-
247
-
248
-
249
-
250
-
251
-
252
-
253
-
254
-
255
-
256
-
257
-
258
-
259
-
260
-
261
-
262
-
263
-
264
-
265
-
266
-
267
-
268
-
269
-
270
-
271
-
272
-
273
-
274
-
275
-
276
-
277
-
278
-
279
-
280
-
281
-
282
-
283
-
284
 |
 |

94
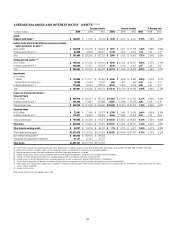
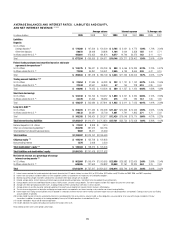
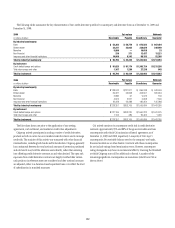
AVERAGE BALANCES AND INTEREST RATES—ASSETS (1)(2)(3)(4)
Average volume Interest revenue % Average rate
In millions of dollars 2009 2008 2007 2009 2008 2007 2009 2008 2007
Assets
Deposits with banks (5) $ 186,841 $ 77,200 $ 53,044 $ 1,478 $ 3,074 $ 3,097 0.79% 3.98% 5.84%
Federal funds sold and securities borrowed or purchased
under agreements to resell (6)
In U.S. offices $ 138,579 $ 164,732 $ 192,824 $ 1,975 $ 5,071 $ 11,728 1.43% 3.08% 6.08%
In offices outside the U.S. (5) 63,909 73,833 129,301 1,109 4,079 6,613 1.74 5.52 5.11
Total $ 202,488 $ 238,565 $ 322,125 $ 3,084 $ 9,150 $ 18,341 1.52% 3.84% 5.69%
Trading account assets (7) (8)
In U.S. offices $ 140,233 $ 221,455 $ 263,922 $ 6,844 $ 12,331 $ 13,557 4.88% 5.57% 5.14%
In offices outside the U.S. (5) 126,309 151,071 171,504 3,879 5,115 4,917 3.07 3.39 2.87
Total $ 266,542 $ 372,526 $ 435,426 $ 10,723 $ 17,446 $ 18,474 4.02% 4.68% 4.24%
Investments
In U.S. offices
Taxable $ 124,404 $ 112,071 $ 136,482 $ 6,208 $ 4,846 $ 6,840 4.99% 4.32% 5.01%
Exempt from U.S. income tax (1) 16,489 13,584 17,796 864 613 909 5.24 4.51 5.11
In offices outside the U.S. (5) 118,988 94,725 108,875 6,047 5,259 5,674 5.08 5.55 5.21
Total $ 259,881 $ 220,380 $ 263,153 $ 13,119 $ 10,718 $ 13,423 5.05% 4.86% 5.10%
Loans (net of unearned income) (9)
Consumer loans
In U.S. offices $ 304,976 $ 339,417 $ 336,742 $ 21,982 $ 27,456 $ 27,794 7.21% 8.09% 8.25%
In offices outside the U.S. (5) 151,262 173,851 157,888 13,402 17,963 17,016 8.86 10.33 10.78
Total consumer loans $ 456,238 $ 513,268 $ 494,630 $ 35,384 $ 45,419 $ 44,810 7.76% 8.85% 9.06%
Corporate loans
In U.S. offices $ 73,961 $ 77,450 $ 62,321 $ 2,709 $ 3,482 $ 5,095 3.66% 4.50% 8.18%
In offices outside the U.S. (5) 116,421 143,806 153,956 9,364 13,435 13,296 8.04 9.34 8.64
Total corporate loans $ 190,382 $ 221,256 $ 216,277 $ 12,073 $ 16,917 $ 18,391 6.34% 7.65% 8.50%
Total loans $ 646,620 $ 734,524 $ 710,907 $ 47,457 $ 62,336 $ 63,201 7.34% 8.49% 8.89%
Other interest-earning assets $ 49,707 $ 94,123 $ 89,742 $ 774 $ 3,775 $ 4,811 1.56% 4.01% 5.36%
Total interest-earning assets $1,612,079 $1,737,318 $1,874,397 $ 76,635 $106,499 $121,347 4.75% 6.13% 6.47%
Non-interest-earning assets (7) $ 264,165 $ 383,150 $ 249,958
Total assets from discontinued operations 15,137 47,010 47,177
Total assets $1,891,381 $2,167,478 $2,171,532
(1) Interest revenue excludes the taxable equivalent adjustments (based on the U.S. federal statutory tax rate of 35%) of $752 million, $323 million, and $125 million for 2009, 2008, and 2007, respectively.
(2) Interest rates and amounts include the effects of risk management activities associated with the respective asset and liability categories.
(3) Monthly or quarterly averages have been used by certain subsidiaries where daily averages are unavailable.
(4) Detailed average volume, interest revenue and interest expense exclude discontinued operations. See Note 3 to the Consolidated Financial Statements.
(5) Average rates reflect prevailing local interest rates, including inflationary effects and monetary corrections in certain countries.
(6) Average volumes of securities borrowed or purchased under agreements to resell are reported net. However, Interest revenue is reflected gross.
(7) The fair value carrying amounts of derivative and foreign exchange contracts are reported in non-interest-earning assets and other non-interest-bearing liabilities.
(8) Interest expense on Trading account liabilities of ICG is reported as a reduction of interest revenue. Interest revenue and interest expense on cash collateral positions are reported in Trading account assets and Trading
account liabilities, respectively.
(9) Includes cash-basis loans.
Reclassified to conform to the current period’s presentation.