Citibank 2009 Annual Report Download - page 159
Download and view the complete annual report
Please find page 159 of the 2009 Citibank annual report below. You can navigate through the pages in the report by either clicking on the pages listed below, or by using the keyword search tool below to find specific information within the annual report.-
 1
1 -
2
-
3
-
4
-
5
-
6
-
7
-
8
-
9
-
10
-
11
-
12
-
13
-
14
-
15
-
16
-
17
-
18
-
19
-
20
-
21
-
22
-
23
-
24
-
25
-
26
-
27
-
28
-
29
-
30
-
31
-
32
-
33
-
34
-
35
-
36
-
37
-
38
-
39
-
40
-
41
-
42
-
43
-
44
-
45
-
46
-
47
-
48
-
49
-
50
-
51
-
52
-
53
-
54
-
55
-
56
-
57
-
58
-
59
-
60
-
61
-
62
-
63
-
64
-
65
-
66
-
67
-
68
-
69
-
70
-
71
-
72
-
73
-
74
-
75
-
76
-
77
-
78
-
79
-
80
-
81
-
82
-
83
-
84
-
85
-
86
-
87
-
88
-
89
-
90
-
91
-
92
-
93
-
94
-
95
-
96
-
97
-
98
-
99
-
100
-
101
-
102
-
103
-
104
-
105
-
106
-
107
-
108
-
109
-
110
-
111
-
112
-
113
-
114
-
115
-
116
-
117
-
118
-
119
-
120
-
121
-
122
-
123
-
124
-
125
-
126
-
127
-
128
-
129
-
130
-
131
-
132
-
133
-
134
-
135
-
136
-
137
-
138
-
139
-
140
-
141
-
142
-
143
-
144
-
145
-
146
-
147
-
148
-
 149
149 -
 150
150 -
 151
151 -
 152
152 -
 153
153 -
 154
154 -
 155
155 -
 156
156 -
 157
157 -
 158
158 -
 159
159 -
 160
160 -
 161
161 -
 162
162 -
 163
163 -
 164
164 -
 165
165 -
 166
166 -
 167
167 -
 168
168 -
 169
169 -
170
-
171
-
172
-
173
-
174
-
175
-
176
-
177
-
178
-
179
-
180
-
181
-
182
-
183
-
184
-
185
-
186
-
187
-
188
-
189
-
190
-
191
-
192
-
193
-
194
-
195
-
196
-
197
-
198
-
199
-
200
-
201
-
202
-
203
-
204
-
205
-
206
-
207
-
208
-
209
-
210
-
211
-
212
-
213
-
214
-
215
-
216
-
217
-
218
-
219
-
220
-
221
-
222
-
223
-
224
-
225
-
226
-
227
-
228
-
229
-
230
-
231
-
232
-
233
-
234
-
235
-
236
-
237
-
238
-
239
-
240
-
241
-
242
-
243
-
244
-
245
-
246
-
247
-
248
-
249
-
250
-
251
-
252
-
253
-
254
-
255
-
256
-
257
-
258
-
259
-
260
-
261
-
262
-
263
-
264
-
265
-
266
-
267
-
268
-
269
-
270
-
271
-
272
-
273
-
274
-
275
-
276
-
277
-
278
-
279
-
280
-
281
-
282
-
283
-
284
 |
 |

149
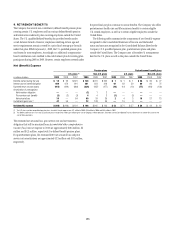
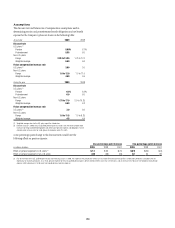
5. INTEREST REVENUE AND EXPENSE
For the years ended December 31, 2009, 2008 and 2007, respectively, interest
revenue and expense consisted of the following:
In millions of dollars 2009 2008 (1) 2007 (1)
Interest revenue
Loan interest, including fees $47,457 $ 62,336 $ 63,201
Deposits with banks 1,478 3,074 3,097
Federal funds sold and securities
purchased under agreements to resell 3,084 9,150 18,341
Investments, including dividends 13,119 10,718 13,423
Trading account assets (2) 10,723 17,446 18,474
Other interest 774 3,775 4,811
Total interest revenue $76,635 $106,499 $121,347
Interest expense
Deposits (3) $10,146 $ 20,271 $ 28,402
Federal funds purchased and
securities loaned or sold under
agreements to repurchase 3,433 11,265 23,003
Trading account liabilities (2) 289 1,257 1,420
Short-term borrowings 1,425 3,911 7,023
Long-term debt 12,428 16,046 16,110
Total interest expense $27,721 $ 52,750 $ 75,958
Net interest revenue $48,914 $ 53,749 $ 45,389
Provision for loan losses 38,760 33,674 16,832
Net interest revenue after
provision for loan losses $10,154 $ 20,075 $ 28,557
(1) Reclassified to conform to the current period’s presentation.
(2) Interest expense on Trading account liabilities of ICG is reported as a reduction of interest revenue
from Trading account assets.
(3) Includes FDIC deposit insurance fees and charges.
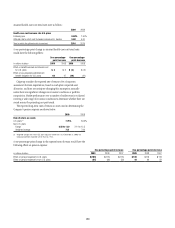
6. COMMISSIONS AND FEES
Commissions and fees revenue includes charges to customers for credit and
bank cards, including transaction-processing fees and annual fees; advisory
and equity and debt underwriting services; lending and deposit-related
transactions, such as loan commitments, standby letters of credit and other
deposit and loan servicing activities; investment management-related fees,
including brokerage services and custody and trust services; and insurance
fees and commissions.
The following table presents commissions and fees revenue for the years
ended December 31:
In millions of dollars 2009 2008 2007
Credit cards and bank cards $ 4,110 $ 4,517 $ 5,036
Investment banking 3,466 2,284 5,228
Smith Barney 837 2,836 3,265
ICG trading-related 1,729 2,322 2,706
Transaction services 1,306 1,423 1,166
Other consumer 1,343 1,211 649
Checking-related 1,043 1,134 1,108
Other ICG 531 747 295
Primerica 314 415 455
Loan servicing (1) 1,858 (1,731) 560
Corporate finance (2) 697 (4,876) (667)
Other (118) 84 267
Total commissions and fees $17,116 $10,366 $20,068
(1) Includes fair value adjustments on mortgage servicing assets. The mark-to-market on the underlying
economic hedges of the MSRs is included in Other revenue.
(2) Includes write-downs of approximately $4.9 billion in 2008 and $1.5 billion in 2007, net of
underwriting fees, on funded and unfunded highly leveraged finance commitments, recorded at fair
value and reported as loans held for sale in Other assets. Write-downs were recorded on all highly
leveraged finance commitments where there was value impairment, regardless of funding date.