Citibank 2009 Annual Report Download - page 86
Download and view the complete annual report
Please find page 86 of the 2009 Citibank annual report below. You can navigate through the pages in the report by either clicking on the pages listed below, or by using the keyword search tool below to find specific information within the annual report.-
 1
1 -
2
-
3
-
4
-
5
-
6
-
7
-
8
-
9
-
10
-
11
-
12
-
13
-
14
-
15
-
16
-
17
-
18
-
19
-
20
-
21
-
22
-
23
-
24
-
25
-
26
-
27
-
28
-
29
-
30
-
31
-
32
-
33
-
34
-
35
-
36
-
37
-
38
-
39
-
40
-
41
-
42
-
43
-
44
-
45
-
46
-
47
-
48
-
49
-
50
-
51
-
52
-
53
-
54
-
55
-
56
-
57
-
58
-
59
-
60
-
61
-
62
-
63
-
64
-
65
-
66
-
67
-
68
-
69
-
70
-
71
-
72
-
73
-
74
-
75
-
 76
76 -
 77
77 -
 78
78 -
 79
79 -
 80
80 -
 81
81 -
 82
82 -
 83
83 -
 84
84 -
 85
85 -
 86
86 -
 87
87 -
 88
88 -
 89
89 -
 90
90 -
 91
91 -
 92
92 -
 93
93 -
 94
94 -
 95
95 -
 96
96 -
97
-
98
-
99
-
100
-
101
-
102
-
103
-
104
-
105
-
106
-
107
-
108
-
109
-
110
-
111
-
112
-
113
-
114
-
115
-
116
-
117
-
118
-
119
-
120
-
121
-
122
-
123
-
124
-
125
-
126
-
127
-
128
-
129
-
130
-
131
-
132
-
133
-
134
-
135
-
136
-
137
-
138
-
139
-
140
-
141
-
142
-
143
-
144
-
145
-
146
-
147
-
148
-
149
-
150
-
151
-
152
-
153
-
154
-
155
-
156
-
157
-
158
-
159
-
160
-
161
-
162
-
163
-
164
-
165
-
166
-
167
-
168
-
169
-
170
-
171
-
172
-
173
-
174
-
175
-
176
-
177
-
178
-
179
-
180
-
181
-
182
-
183
-
184
-
185
-
186
-
187
-
188
-
189
-
190
-
191
-
192
-
193
-
194
-
195
-
196
-
197
-
198
-
199
-
200
-
201
-
202
-
203
-
204
-
205
-
206
-
207
-
208
-
209
-
210
-
211
-
212
-
213
-
214
-
215
-
216
-
217
-
218
-
219
-
220
-
221
-
222
-
223
-
224
-
225
-
226
-
227
-
228
-
229
-
230
-
231
-
232
-
233
-
234
-
235
-
236
-
237
-
238
-
239
-
240
-
241
-
242
-
243
-
244
-
245
-
246
-
247
-
248
-
249
-
250
-
251
-
252
-
253
-
254
-
255
-
256
-
257
-
258
-
259
-
260
-
261
-
262
-
263
-
264
-
265
-
266
-
267
-
268
-
269
-
270
-
271
-
272
-
273
-
274
-
275
-
276
-
277
-
278
-
279
-
280
-
281
-
282
-
283
-
284
 |
 |
76
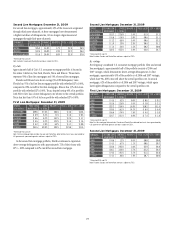
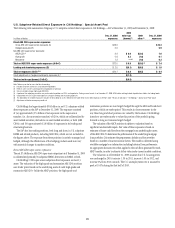
Balances: December 31, 2009—Second Lien Mortgages
AT
ORIGINATION FICO ≥ 660 620 ≤ FICO
<660
FICO < 620
LTV ≤ 80% 48% 2% 2%
80% < LTV ≤ 100% 43% 3% 2%
LTV > 100% NM NM NM
REFRESHED FICO ≥ 660 620 ≤ FICO
<660
FICO<620
LTV ≤ 80% 23% 1% 3%
80% < LTV ≤ 100% 23% 2% 5%
LTV > 100% 29% 4% 10%
Note: NM—Not meaningful. Second lien mortgage table excludes loans in Canada and Puerto Rico. Table
excludes loans subject to LTSCs. Table also excludes $1.7 billion from At Origination balances and $0.8
billion from Refreshed balances for which FICO or LTV data were unavailable. Refreshed FICO scores,
based on updated credit scores obtained from Fair Isaac Corporation. Refreshed LTV ratios are derived
from data at origination updated using mainly the Case-Shiller Home Price Index or the Federal Housing
Finance Agency Price Index.
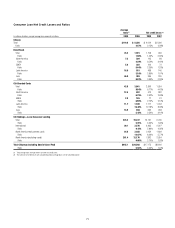
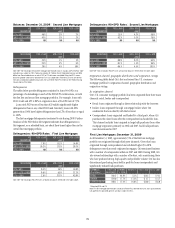
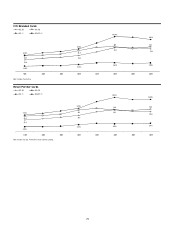
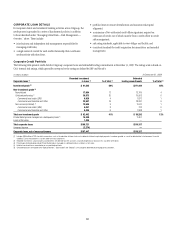
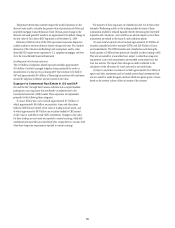
Delinquencies
The tables below provide delinquency statistics for loans 90+DPD, as a
percentage of outstandings in each of the FICO/LTV combinations, in both
the first lien and second lien mortgage portfolios. For example, loans with
FICO ≥ 660 and LTV ≤ 80% at origination have a 90+DPD rate of 7.9%.
Loans with FICO scores of less than 620 exhibit significantly higher
delinquencies than in any other FICO band. Similarly, loans with LTVs
greater than 100% have higher delinquencies than LTVs of less than or equal
to 100%.
The first mortgage delinquencies continued to rise during 2009. Further
breakout of the FICO below 620 segment indicates that delinquencies in
this segment, on a refreshed basis, are about three times higher than in the
overall first mortgage portfolio.
Delinquencies: 90+DPD Rates—First Lien Mortgages
AT
ORIGINATION
FICO ≥ 660 620 ≤ FICO
<660
FICO < 620
LTV ≤ 80% 7.9% 13.1% 14.0%
80% < LTV ≤ 100% 10.2% 17.3% 20.7%
LTV > 100% NM NM NM
REFRESHED FICO ≥ 660 620 ≤ FICO
<660
FICO < 620
LTV ≤ 80% 0.3% 3.8% 18.0%
80% < LTV ≤ 100% 0.8% 8.5% 27.3%
LTV > 100% 2.8% 23.3% 42.0%
Note: NM—Not meaningful. 90+DPD rates are based on balances referenced in the tables above.
Delinquencies: 90+DPD Rates—Second Lien Mortgages
AT
ORIGINATION
FICO ≥ 660 620 ≤ FICO
<660
FICO < 620
LTV ≤ 80% 1.5% 4.2% 5.6%
80% < LTV ≤ 100% 4.2% 5.3% 7.6%
LTV > 100% NM NM NM
REFRESHED FICO ≥ 660 620 ≤ FICO
<660
FICO < 620
LTV ≤ 80% 0.0% 0.7% 8.5%
80% < LTV ≤ 100% 0.1% 1.3% 9.8%
LTV > 100% 0.4% 4.5% 19.3%
Note: NM—Not meaningful. 90+DPD rates are based on balances referenced in the tables above.
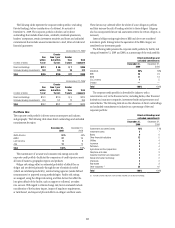
Origination channel, geographic distribution and origination vintage
The following tables detail Citi’s first and second lien U.S. consumer
mortgage portfolio by origination channel, geographic distribution and
origination vintage.
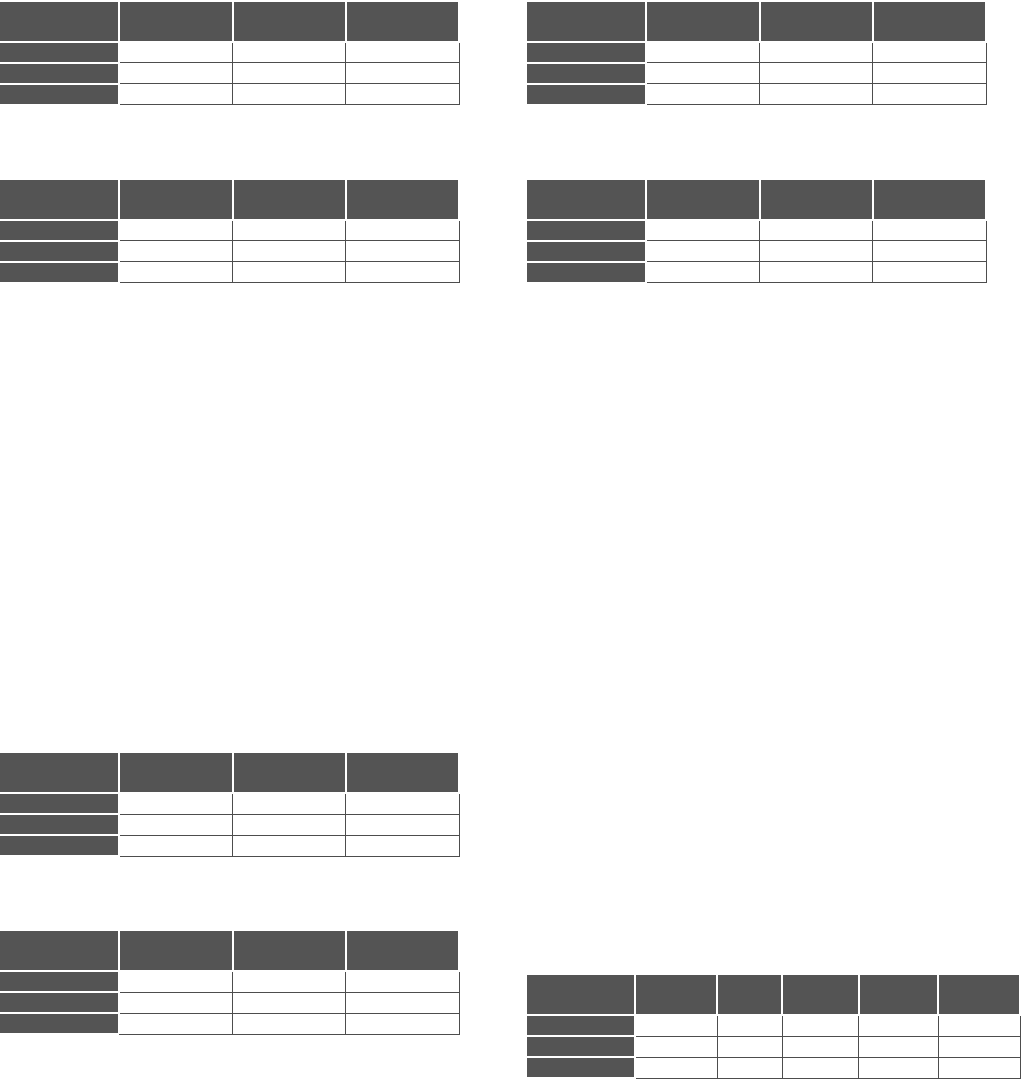
By origination channel
Citi’s U.S. consumer mortgage portfolio has been originated from three main
channels: retail, broker and correspondent.
Retail: loans originated through a direct relationship with the borrower. •
Broker: loans originated through a mortgage broker, where Citi •
underwrites the loan directly with the borrower.
Correspondent: loans originated and funded by a third party, where Citi •
purchases the closed loans after the correspondent has funded the loan.
This channel includes loans acquired in large bulk purchases from other
mortgage originators primarily in 2006 and 2007. Such bulk purchases
were discontinued in 2007.
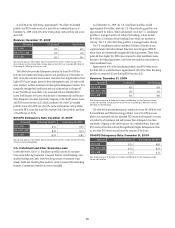
First Lien Mortgages: December 31, 2009
As of December 31, 2009, approximately 55% of the first lien mortgage
portfolio was originated through third-party channels. Given that loans
originated through correspondents have exhibited higher 90+DPD
delinquency rates than retail originated mortgages, Citi terminated business
with a number of correspondent sellers in 2007 and 2008. During 2008, Citi
also severed relationships with a number of brokers, only maintaining those
who have produced strong, high-quality and profitable volume. Citi has also
discontinued purchasing loans held in portfolio from correspondents and
significantly reduced bulk purchases.
CHANNELS
($ in billions)
FIRST LIEN
MORTGAGES
CHANNEL
% TOTAL
90+DPD % *FICO < 620 *LTV > 100%
RETAIL $48.2 44.9% 5.1% $14.3 $ 9.1
BROKER $19.0 17.7% 11.3% $ 3.7 $ 5.7
CORRESPONDENT $40.1 37.4% 16.6% $14.0 $15.0
* Refreshed FICO and LTV.
Note: First lien mortgage table excludes Canada and Puerto Rico, deferred fees/costs, loans guaranteed by
U.S. government sponsored agencies and loans subject to LTSCs.