Citibank 2009 Annual Report Download - page 96
Download and view the complete annual report
Please find page 96 of the 2009 Citibank annual report below. You can navigate through the pages in the report by either clicking on the pages listed below, or by using the keyword search tool below to find specific information within the annual report.-
 1
1 -
2
-
3
-
4
-
5
-
6
-
7
-
8
-
9
-
10
-
11
-
12
-
13
-
14
-
15
-
16
-
17
-
18
-
19
-
20
-
21
-
22
-
23
-
24
-
25
-
26
-
27
-
28
-
29
-
30
-
31
-
32
-
33
-
34
-
35
-
36
-
37
-
38
-
39
-
40
-
41
-
42
-
43
-
44
-
45
-
46
-
47
-
48
-
49
-
50
-
51
-
52
-
53
-
54
-
55
-
56
-
57
-
58
-
59
-
60
-
61
-
62
-
63
-
64
-
65
-
66
-
67
-
68
-
69
-
70
-
71
-
72
-
73
-
74
-
75
-
76
-
77
-
78
-
79
-
80
-
81
-
82
-
83
-
84
-
85
-
 86
86 -
 87
87 -
 88
88 -
 89
89 -
 90
90 -
 91
91 -
 92
92 -
 93
93 -
 94
94 -
 95
95 -
 96
96 -
 97
97 -
 98
98 -
 99
99 -
 100
100 -
 101
101 -
 102
102 -
 103
103 -
 104
104 -
 105
105 -
 106
106 -
107
-
108
-
109
-
110
-
111
-
112
-
113
-
114
-
115
-
116
-
117
-
118
-
119
-
120
-
121
-
122
-
123
-
124
-
125
-
126
-
127
-
128
-
129
-
130
-
131
-
132
-
133
-
134
-
135
-
136
-
137
-
138
-
139
-
140
-
141
-
142
-
143
-
144
-
145
-
146
-
147
-
148
-
149
-
150
-
151
-
152
-
153
-
154
-
155
-
156
-
157
-
158
-
159
-
160
-
161
-
162
-
163
-
164
-
165
-
166
-
167
-
168
-
169
-
170
-
171
-
172
-
173
-
174
-
175
-
176
-
177
-
178
-
179
-
180
-
181
-
182
-
183
-
184
-
185
-
186
-
187
-
188
-
189
-
190
-
191
-
192
-
193
-
194
-
195
-
196
-
197
-
198
-
199
-
200
-
201
-
202
-
203
-
204
-
205
-
206
-
207
-
208
-
209
-
210
-
211
-
212
-
213
-
214
-
215
-
216
-
217
-
218
-
219
-
220
-
221
-
222
-
223
-
224
-
225
-
226
-
227
-
228
-
229
-
230
-
231
-
232
-
233
-
234
-
235
-
236
-
237
-
238
-
239
-
240
-
241
-
242
-
243
-
244
-
245
-
246
-
247
-
248
-
249
-
250
-
251
-
252
-
253
-
254
-
255
-
256
-
257
-
258
-
259
-
260
-
261
-
262
-
263
-
264
-
265
-
266
-
267
-
268
-
269
-
270
-
271
-
272
-
273
-
274
-
275
-
276
-
277
-
278
-
279
-
280
-
281
-
282
-
283
-
284
 |
 |
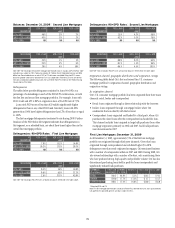
86
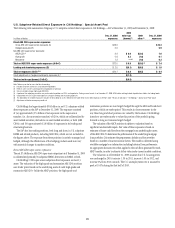
The primary drivers that currently impact the model valuations are the
discount rates used to calculate the present value of projected cash flows and
projected mortgage loan performance. Each 10-basis-point change in the
discount rate used generally results in an approximate $24 million change in
the fair value of Citi’s direct ABCP exposures as of December 31, 2009.
Estimates of the fair value of the CDO super-senior exposures depend on
market conditions and are subject to further change over time. For a further
discussion of the valuation methodology and assumptions used to value
direct ABS CDO super-senior exposures to U.S. subprime mortgages, see Note
26 to the Consolidated Financial Statements.
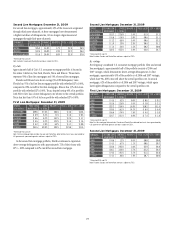
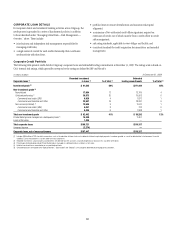
Lending and structuring exposures
The $1.0 billion of subprime-related exposures includes approximately
$0.6 billion of actively managed subprime loans purchased for resale or
securitization at a discount to par during 2007 that continue to be held by
SAP and approximately $0.4 billion of financing transactions with customers
secured by subprime collateral, and are carried at fair value.
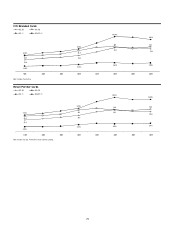
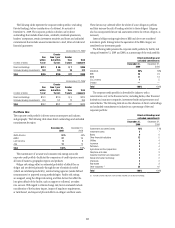
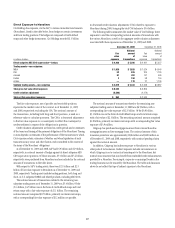
Exposure to Commercial Real Estate in ICG and SAP
ICG and the SAP, through their business activities and as capital markets
participants, incur exposures that are directly or indirectly tied to the
commercial real estate (CRE) market. These exposures are represented
primarily by the following three categories:
(1) Assets held at fair value include approximately $5.5 billion, of
which approximately $4.6 billion are securities, loans and other items
linked to CRE that are carried at fair value as trading account assets, and
of which approximately $0.9 billion are securities backed by CRE carried
at fair value as available-for-sale (AFS) investments. Changes in fair value
for these trading account assets are reported in current earnings, while AFS
investments are reported in Accumulated other comprehensive income with
other-than-temporary impairments reported in current earnings.
The majority of these exposures are classified as Level 3 in the fair value
hierarchy. Weakening activity in the trading markets for some of these
instruments resulted in reduced liquidity, thereby decreasing the observable
inputs for such valuations, and could have an adverse impact on how these
instruments are valued in the future if such conditions persist.
(2) Assets held at amortized cost include approximately $1.8 billion of
securities classified as held-to-maturity (HTM) and $20.9 billion of loans
and commitments. The HTM securities were classified as such during the
fourth quarter of 2008 and were previously classified as either trading or AFS.
They are accounted for at amortized cost, subject to other-than-temporary
impairment. Loans and commitments are recorded at amortized cost, less
loan loss reserves. The impact from changes in credit is reflected in the
calculation of the allowance for loan losses and in net credit losses.
(3) Equity and other investments include approximately $4.3 billion of
equity and other investments such as limited partner fund investments that
are accounted for under the equity method, which recognizes gains or losses
based on the investor’s share of the net income of the investee.